Understanding gun violence in New York City requires both a macro and micro perspective. Yesterday’s interview with scholar and trained epidemiologist Ernest Drucker, from Columbia’s Mailman School of Public Health, a Scholar in Residence at John Jay College of Criminal Justice, highlighted some of the broad and underlying issues related to drugs and race and ethnicity in New York City.
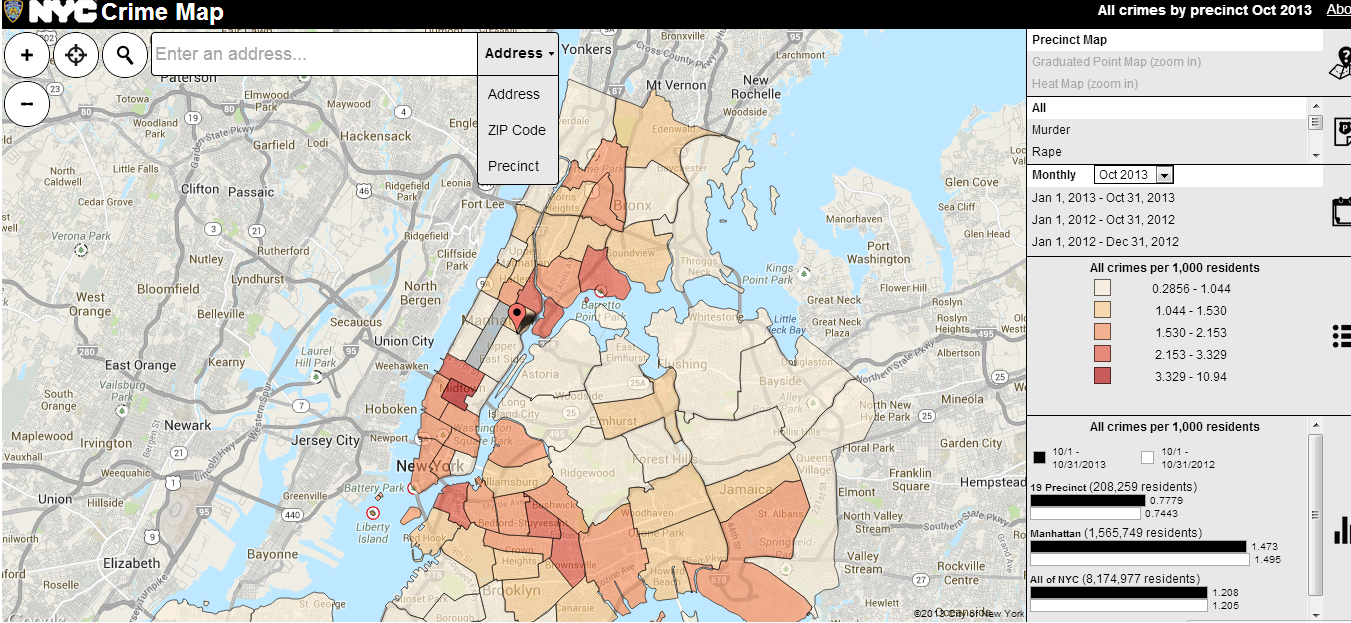
Recently, the NYPD released a an interactive Crime Map that allows you to see the instances of crimes as a heat map shaded by precinct when viewed zoomed out, and by graduated points when zoomed in.
Using data and charts from the Neighborhood Crime and Drug Project, directed by John Jay Faculty in the Department of Anthropology, Ric Curtis, Josh Eichenbaum, and Ernest Drucker, we decided to explore the more neighborhood and personal experiences with guns in New York City.
Specifically, I was interested in three things:
- Differences in how genders perceive and experience guns and gun violence.
- Difference in the experience of gun violence among age groups in New York City.
- Neighborhood level experiences with guns.
Using their data and the free data visualization tool, Tableu Public, I created my own graphics to supplement the findings presented by the Neighborhood Crime and Drug Project.
Please note: These findings are based on a limited survey conducted throughout NYC neighborhoods, so it is not comprehensive.
-
Residents in neighborhoods in South Bronx and Central Brooklyn report having heard the most gun fire.
This interactive bubble chart which you can access here, breaks down reports of hearing gun fire by NYC neighborhood. The blue bubbles in the center represent those neighborhoods that report hearing gun fire. Then the size of the bubble represents the numbers of reports for that given neighborhood. I used a bubble chart in this instance because it can quickly display hundreds of individual values at once.
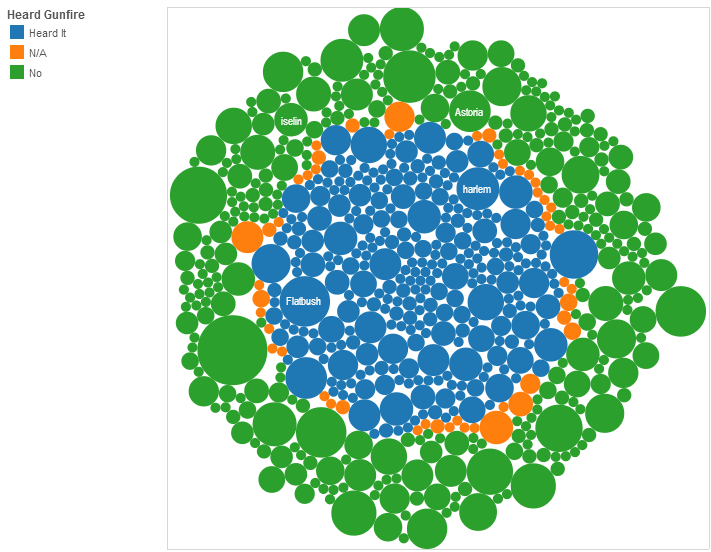
- Credit: JustPublics@365
2. The age group most likely to know someone with a gun is 18-29. It peaks at age 21 and then drops accordingly by age.
The second age group most likely to know someone with a gun is 30-44. The age group less likely to know someone with a gun is over 60. This hints at a possible social dimension to gun use and violence among NYC youth.
Below are two simple charts which illustrate this. As you can see in the second chart below, the instances of knowing someone with a gun peaks at 21 and then drops the older you get.
18-29 year olds have the highest instances of knowing someone with a gun.
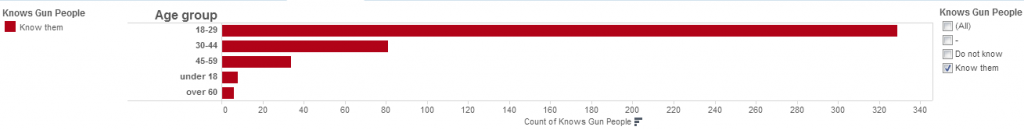
- Credit: JustPublics@365
- 21 year olds in New York City are the most likely to know someone with a gun.
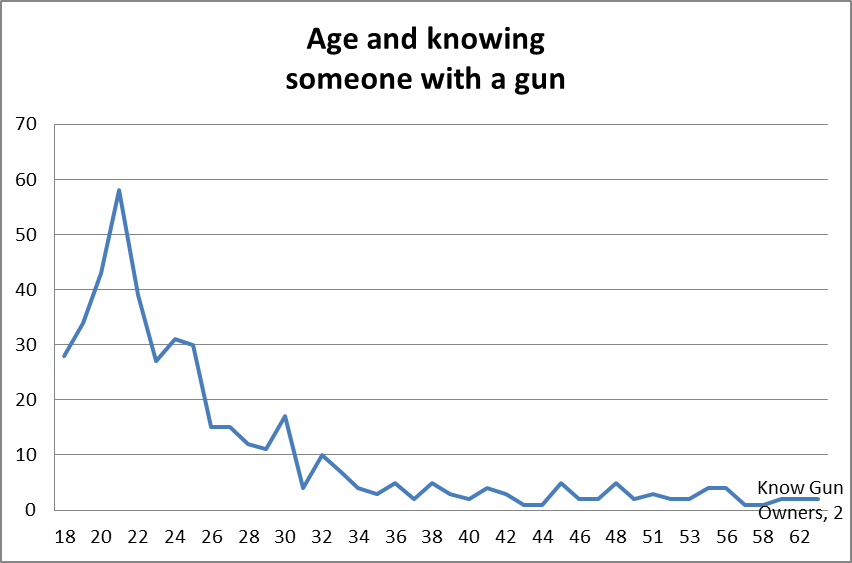 Credit: Neighborhood Crime and Drug Project at John Jay University

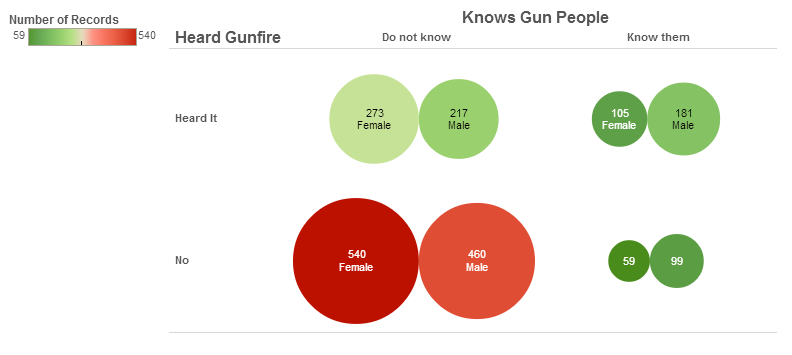
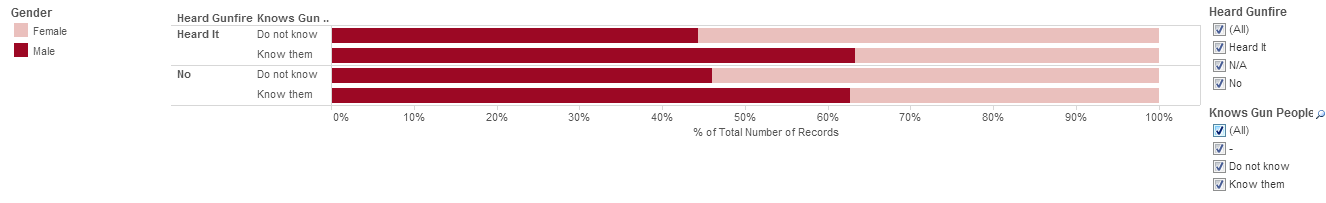
3. Men in NYC are more likely to know someone with a gun, but women in NYC are more likely to have heard a gun shot.
This chart highlights how experiences of gun violence can differ by gender in New York City; as men are more likely to report that they know someone with a gun.
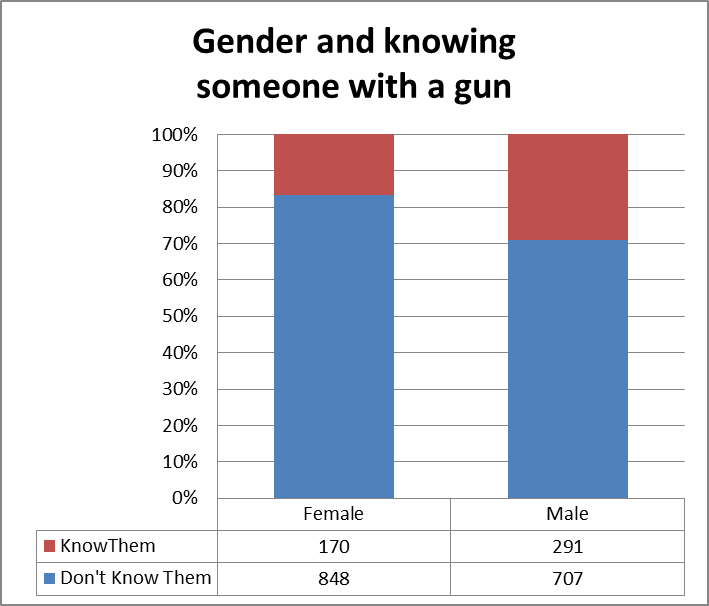
- Credit: Neighborhood Crime and Drug Project at John Jay University
- Credit: JustPublics@365
 Credit: JustPublics@365
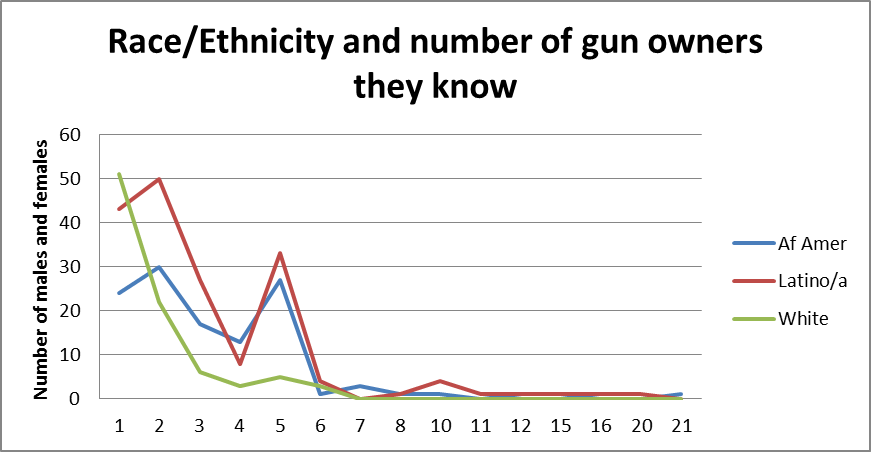
4. African Americans are more likely to know someone with a gun. However, Latino/as on average tend to know more gun owners.
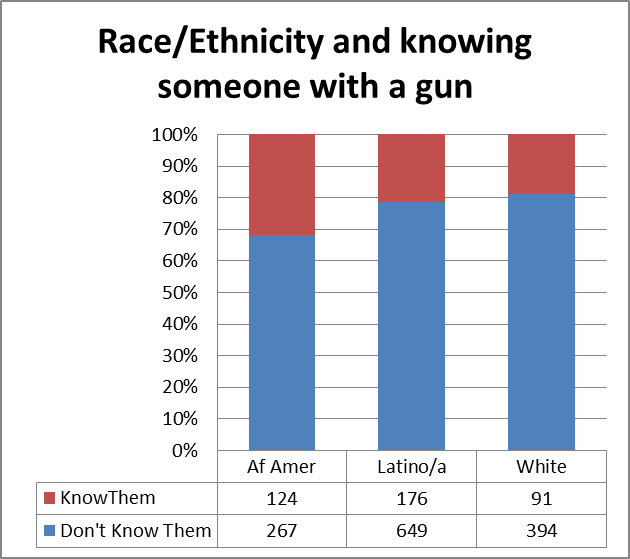
- Credit: Neighborhood Crime and Drug Project at John Jay University
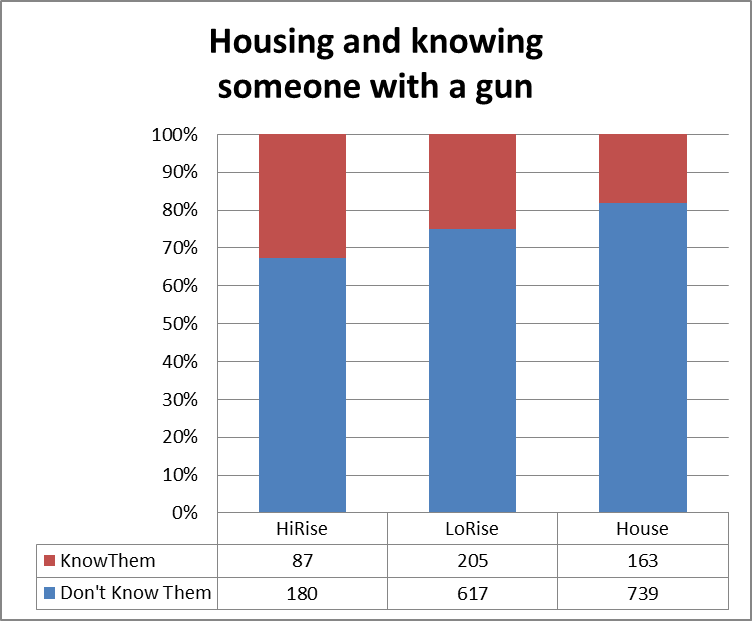
5. Residents in Public Housing and High-Rises Are More Likely To Know Someone with a Gun
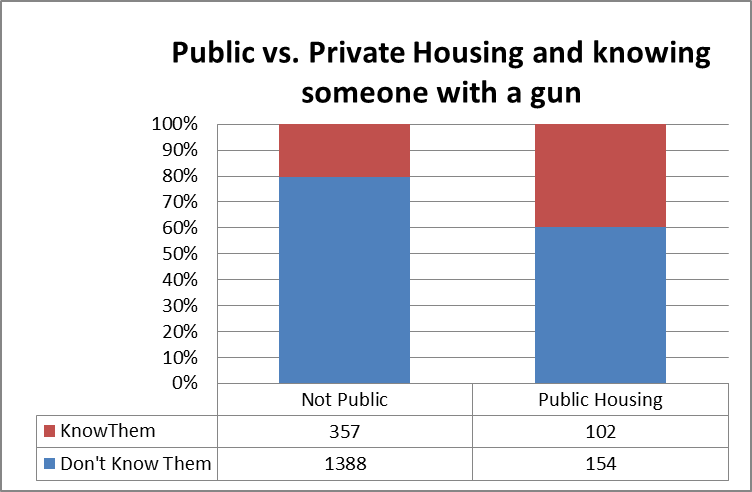
- Credit: Neighborhood Crime and Drug Project at John Jay University
- Credit: Neighborhood Crime and Drug Project at John Jay University