Author Archives: Wilneida Negron

Understanding Gun Violence in New York City: 10 Charts to Get You Started

Understanding gun violence in New York City requires both a macro and micro perspective.  Yesterday’s interview with scholar and trained epidemiologist Ernest Drucker, from Columbia’s Mailman School of Public Health, a Scholar in Residence at John Jay College of Criminal Justice, highlighted some of the broad and underlying issues related to drugs and race and ethnicity in New York City.  

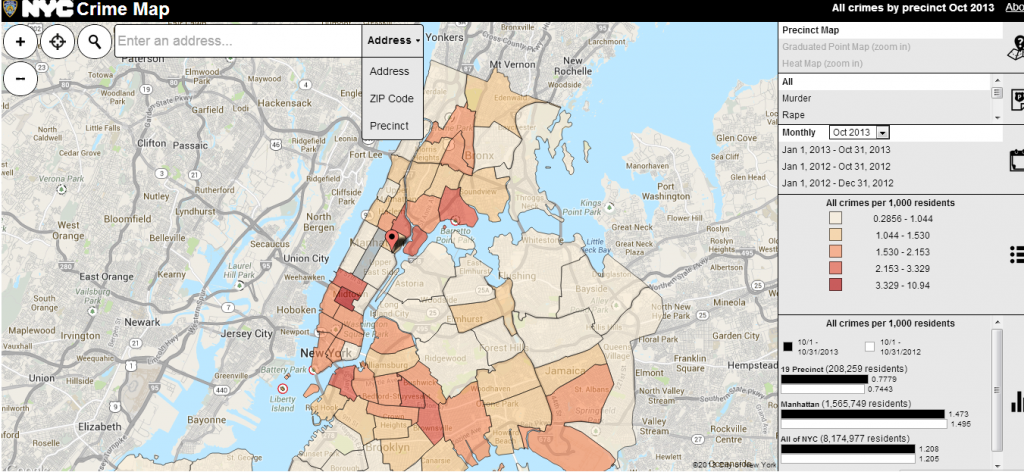
Recently, the NYPD released a an interactive Crime Map that allows you to see the instances of crimes as a heat map shaded by precinct when viewed zoomed out, and by graduated points when zoomed in.

NYC Crime Map  

Using data and charts from the Neighborhood Crime and Drug Project, directed by John Jay Faculty in the Department of Anthropology, Ric Curtis, Josh Eichenbaum, and Ernest Drucker, we decided to explore the more neighborhood and personal experiences with guns in New York City.

Specifically, I was interested in three things:

  1. Differences in how genders perceive and experience guns and gun violence.
  2. Difference in the experience of gun violence among age groups in New York City.
  3. Neighborhood level experiences with guns.

Using their data and the free data visualization tool, Tableu Public, I created my own graphics to supplement the findings presented by the Neighborhood Crime and Drug Project.  

Please note: These findings are based on a limited survey conducted throughout NYC neighborhoods, so it is not comprehensive.

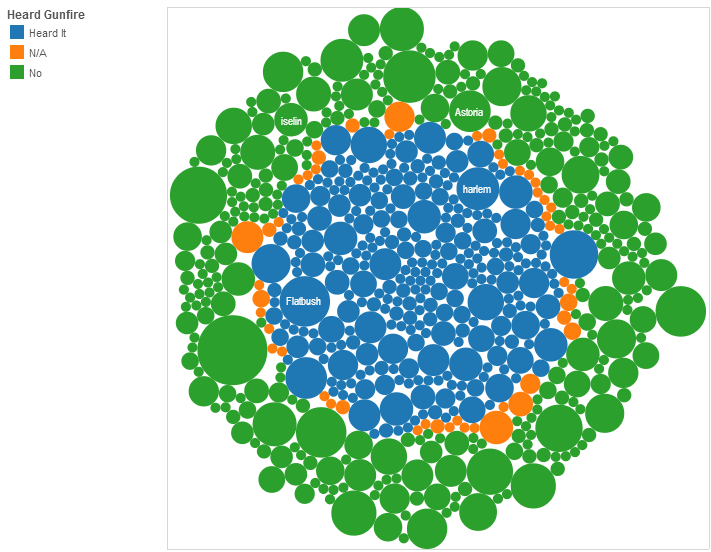
  1. Residents in neighborhoods in South Bronx and Central Brooklyn report having heard the most gun fire.

This interactive bubble chart which you can access here, breaks down reports of hearing gun fire by NYC neighborhood.  The blue bubbles in the center represent those neighborhoods that report hearing gun fire.  Then the size of the bubble represents the numbers of reports for that given neighborhood.  I used a bubble chart in this instance because it can quickly display hundreds of individual values at once.

gun by neighborhood
Credit: JustPublics@365

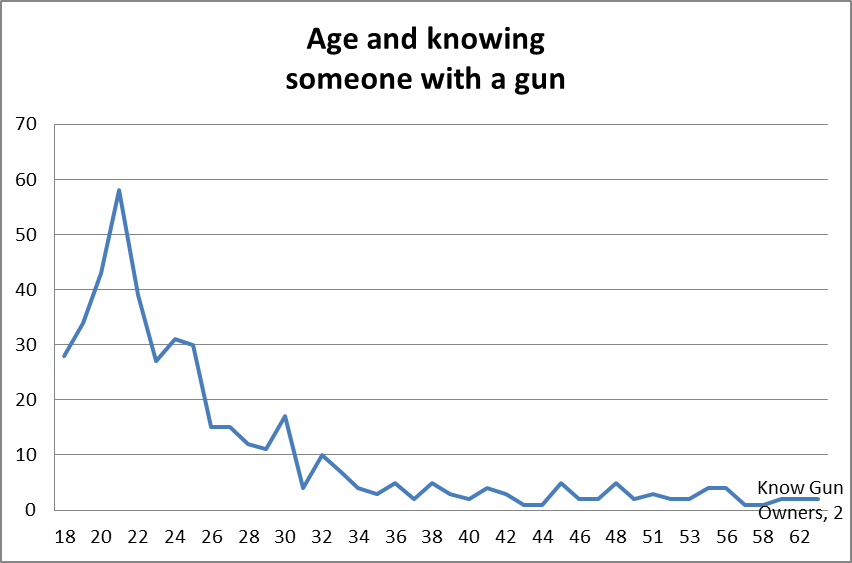
2. The age group most likely to know someone with a gun is 18-29.  It peaks at age 21 and then drops accordingly by age. 

The second age group most likely to know someone with a gun is 30-44.  The age group less likely to know someone with a gun is over 60.  This hints at a possible social dimension to gun use and violence among NYC youth.

Below are two simple charts which illustrate this.  As you can see in the second chart below, the instances of knowing someone with a gun peaks at 21 and then drops the older you get.

18-29 year olds have the highest instances of knowing someone with a gun. 
gunbyage group
Credit: JustPublics@365
 21 year olds in New York City are the most likely to know someone with a gun.  age and knowingCredit: Neighborhood Crime and Drug Project at John Jay University

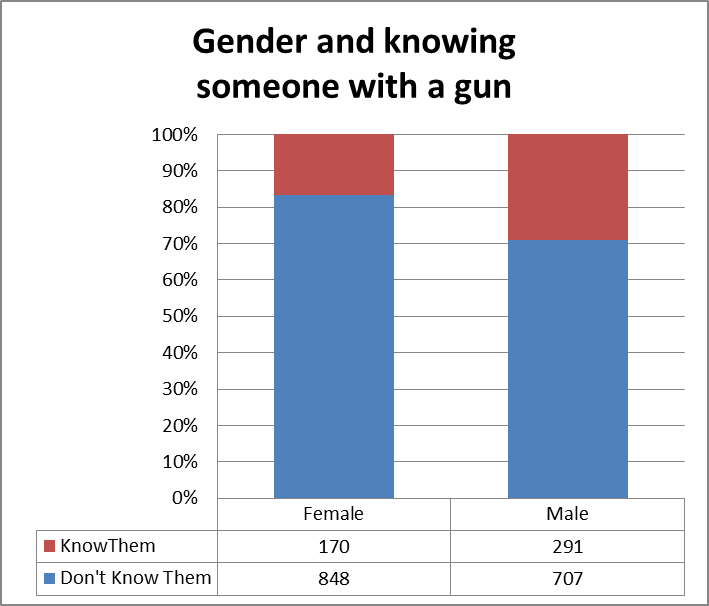
3. Men in NYC are more likely to know someone with a gun, but women in NYC are more likely to have heard a gun shot.

This chart highlights how experiences of gun violence can differ by gender in New York City; as men are more likely to report that they know someone with a gun.

gender and gun
Credit: Neighborhood Crime and Drug Project at John Jay University
scatterplot
Credit: JustPublics@365
gundont know themCredit: JustPublics@365

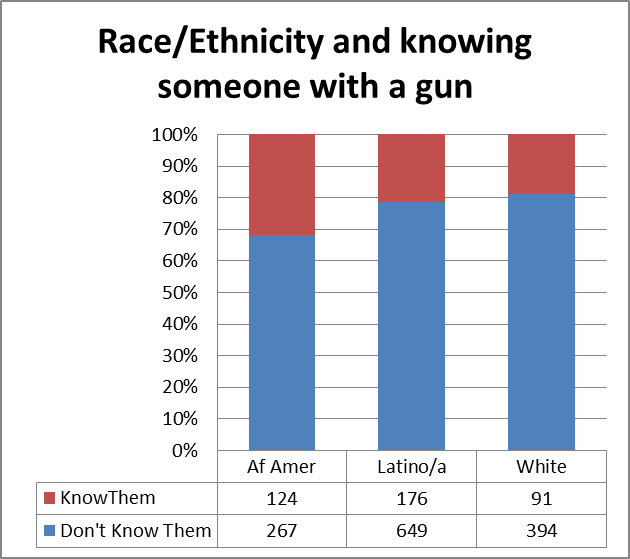
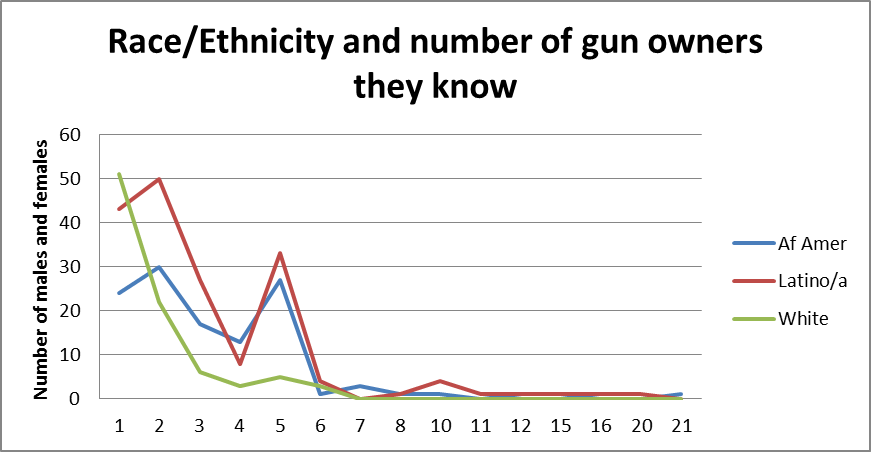
4. African Americans are more likely to know someone with a gun.  However, Latino/as on average tend to know more gun owners.    

race and gun
Credit: Neighborhood Crime and Drug Project at John Jay University

race and number of gun owners 

Credit: Neighborhood Crime and Drug Project at John Jay University

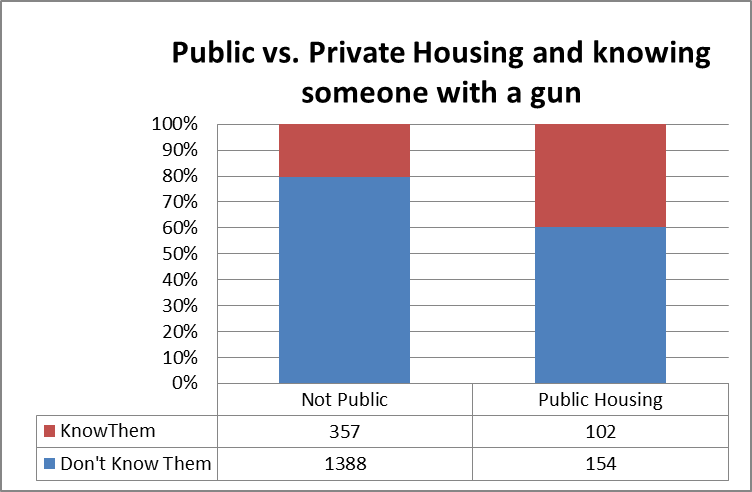
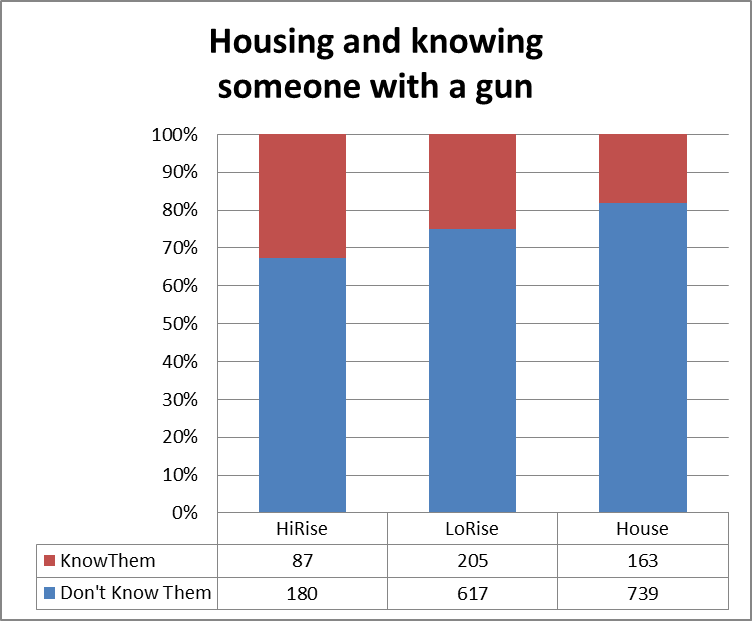
5. Residents in Public Housing and High-Rises Are More Likely To Know Someone with a Gun 

public housing and gun
Credit: Neighborhood Crime and Drug Project at John Jay University


high rise and guns
Credit: Neighborhood Crime and Drug Project at John Jay University


Mapping Social Inequities: Using Evernote for Evidence-Gathering

 Mapping Social Inequities

Although my post last week discussed how data visualizations such as maps could be used to promote social change, often overlooked are discussions regarding tips and tools for gathering evidence which can be used for mapping social inequities.  Therefore, this post explores how Evernote 5 can be used as a free and powerful evidence-gathering digital tool for highlighting social inequities. Evernote 5 is available for free for both Mac and recently released for Windows.

In an interview with Eric Cadora from The Justice Mapping Center, for our From Punishment To Public Health (P2PH) Social Justice Topic Series, he showcases how maps can expose the cross-sections between public health and public safety in vulnerable communities.  Specifically, Cadora finds that populations which often experience chronic ill-health are often also the same populations which are in and out of prison and jail.  Other studies have found a correlation between crime and chronic disease, which are often reinforced by high levels of health illiteracy and disparity (The Poverty Clinic, Paul Tough).

As the worlds of public health and public safety continue to merge, this presents valuable opportunities for academics and social justice advocates to document and gather evidence of how these dynamics play out within their communities.

I decided to begin my own evidence-gathering efforts as I went about my travels throughout New York City.  For my exercise, I was interested in gathering evidence on the types and number of community health clinics that existed in high crime NYC neighborhoods.

In order to do this, I downloaded both the App and web version of Evernote 5 (App versions are available for Iphones and Android).

For those not familiar, Evernote is a note-taking and clipping application that lets you save all kinds of bits of information into various project-oriented “notebooks.” Academics have been using Evernote to write dissertations or articles, conduct classes and research, etc.  However, less is known about how it can be used for evidence and information-gathering.

FOR STARTERS – Aspects of Evernote that make it an especially useful tool for evidence-gathering are:

  • Ability to go almost completely paperless! Digitize your physical notes and back them up in the cloud. This can come especially handy when ensuring the protection of sensitive documents and information.
  • Allows you to collect an array of multi-media and documents and keep it neatly organized and searchable: You can further use Evernote’s tagging feature and then take advantage of their amazing search and filtering capabilities. In Evernote, you can search by: keywords, tags, dates, or note types (such as images, audio, PDF, etc.). Evernote’s optical character recognition capability (OCR) also converts images of letters/numbers into searchable text (for example as in words from a photo, scanned document, or PDF).
  • Use your personal Evernote email address @m.evernote.com: This allows you to email notes to specific project notebooks and keep your evidence well-organized.
  • Collaborate and share your work with others: Create a link to a private shared workspace and send it to everyone involved. At the same time, you can make any of your notebooks publics which can then be posted on a webpage or included in an email.
  • Dictate your thoughts, ideas or conversations if you have a smart mobile device. You can then use Voice2Note to then convert audio notes into text to make them easily searchable. Simply connect your Evernote account and the first 30 seconds of your notes will be transcribed.
  • Use the Atlas feature to capture GPS information along with the notes you take (now available in Evernote 5): For example, you can use this if you want to capture the specific location of an event, where evidence was found or collected, image taken, etc.
  • This in return allows you to start visualizing geo-specific trends that may either highlight gaps in your evidence-gathering or important issues and patterns that warrant further exploration.  Most importantly, it allows you to start outlining the key trends for your mapping visualization.
  • The Evernote app allows you to effortlessly capture evidence during your day-to-day activities: This means that you will always be prepared to quickly capture, geo-code, and catalog a valuable piece of information for future reference.

Setting Up Your Evernote Evidence-Gathering Notebook

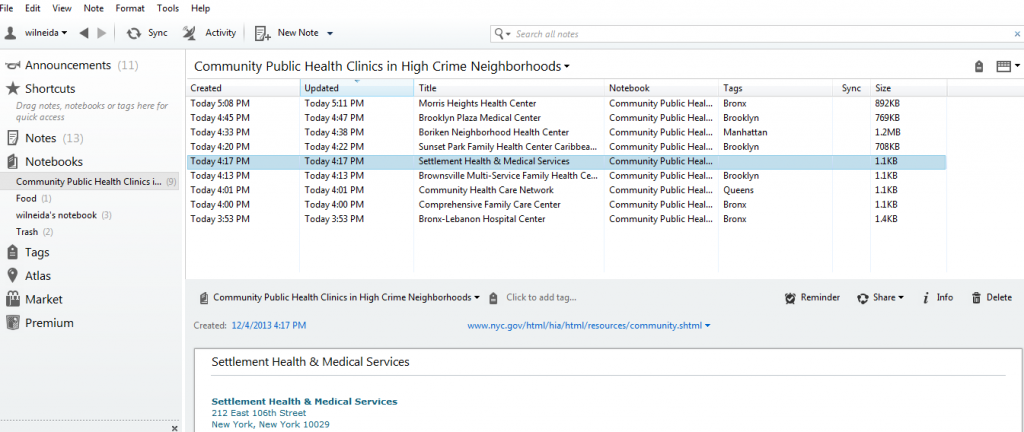
Using the web version of Evernote 5, I create a notebook called, Community Public Health Clinics in High Crime Neighborhoods.  Once I created this notebook, I was then able to upload evidence of community public health clinics in several forms, notes, images, audio, or video.

evernote 5

My evidence-gathering notebook where I can upload notes, images, audio, or video and geo-code them.

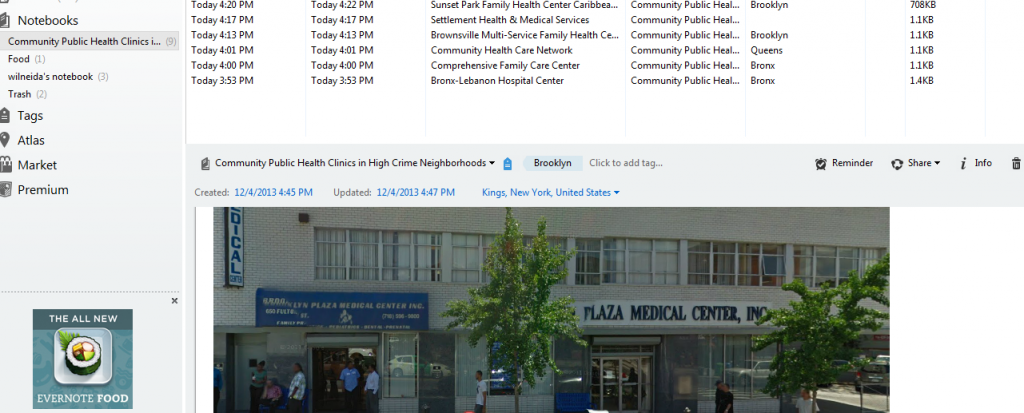
evernote evidence gathering                    Here you can see images of the clinics I have uploaded for future reference. 


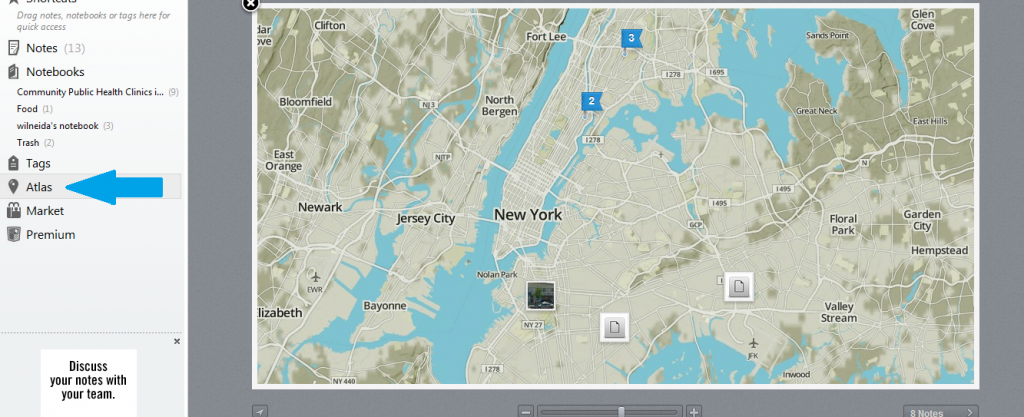
Finally, Evernote 5’s Atlas feature allows me to see my notes, images, and pictures in map view.  This map views helps (a) to ensure that you are covering all the locations/areas that you want to focus on and (b) helps ensure the accuracy of the location for each piece of evidence collected.  

evernote 3Here you can see images and notes regarding community health clinics which I have uploaded for future reference.

Final Thoughts

Moving beyond map visualizations, there are many contexts and ways to use evidence for promoting social justice.  Consider, these real-life examples from the New Tactics in Human Rights website of the types of social justice contexts which Evernote’s features could be most useful for:

Documenting cases of injustices that can be used as legal documentation in courts: See example of collaboration between a human rights group and local monitoring teams in Yemen.

For coordinating and gathering info during participatory research: Read about how groups and individuals in Mozambique launched a collaborative effort to train locals on data gathering which also gave local NGOs a concrete research instrument they could use for future endeavors.
Using technology to share and gather information on environmental hazards: This is where Evernote’s mapping/Atlas feature can really come in! Read about how Environmental Defense used technology to categorize information about harmful environmental hazards such as air pollutants, toxic chemicals, etc.
Collect and preserve community stories and testimonies: Read about how scholars trained in reading and interpreting the texts worked with locals in Tibet to enter ancient text into an electronic database.

***

This post is part of the Monthly Social Justice Topic Series on From Punishment To Public Health (P2PH). If you have any questions, research that you would like to share related to P2PH or are interested in being interviewed for the series, please contact Morgane Richardson at justpublics365@gmail.com with the subject line, “P2PH Series.”

Data Advocacy: Visualizations for Promoting Change

The report, Blueprint for a Public Health and Safety Approach to Drug Policy, by the Drug Policy Alliance and The New York Academy of Medicine provides a comprehensive set of recommendations for fixing a broken drug policy that is a “bifurcation between two different and often contradictory approaches – one which treats drug use as a crime and the other view, as a chronic relapsing health or behavioral condition.”

Anyone who has spent time working in human services knows that multiple programs (whether offered through community groups, nonprofits, churches, or government agencies at the local, state, and federal level), own a piece of the puzzle when it comes to helping and healing people and families. In the case of substance abuse treatment, there’s a myriad of actors in health/mental health, schools, substance abuse services, law enforcement, corrections, and departments of children and families who all need to be coordinating and working together. However, as the Blueprint highlights, this does not always happen. Rather, “without a united framework and better coordination, these actors and agencies often work at cross-purposes” (Blueprint Report, pg. 4). The themes of coordination, overlapping, and cross-purposes appear throughout the report, and these are what I highlight in the discussion of data visualization here.

Provoking Change: Your Data Can Tell a Story

Data visualizations can tell a clear concise story about why an issue is important and why change is needed. So, they are ideal tools for fostering greater awareness and supporting advocacy efforts.

Data visualizations are often associated with their popular counterparts, information graphics (aka infographics).  Although both allow you to use and transform your data into a compelling presentation or powerful story, there is a key difference between the two. While data visualizations take complex sets of data and display them in a graphical interface, like a chart or map, so users can gain insight into patterns and trends, infographics use data visualizations in concert with text and other tactics to tell a story, make a point or communicate a concept (“Data Visualization and Infographics: Using Data to Tell Your Story”).

Visualizations are especially effective for data advocacy because they:

  • Make your message more compelling: Let’s face it, visualizations are simply much better at stimulating thought and conversation than more traditional textual or numerical data.
  • Allow you to reach a wider and more diverse audience:  The reason for this is that visualizations allow you to convey complex data and abstract information in an easily digestible and shareable formats.
  • Visualize information, systems, networks and flows which can be valuable for highlighting social problems and need for policy changes.
  • Illustrate timelines and relationships that can help readers put the dots together in understanding a problem (“Data Visualization and Infographics: Using Data to Tell Your Story”).

Visualizing New York Drug Policy

This next section outlines step-by-step instructions to create your own data visualization. I searched NYC Open Data and Open Data NY Gov for the best data set that would help me highlight the idea of overlapping human services agencies that work on substance abuse issues in New York State. The best data set I found was one which provided information on Local Mental Health Program in New York State, broken by county and program subcategory.

Because of the geographic nature of this data, I opted to create a heat map.  Because I was also interested seeing the distribution of the types of substance abuse mental health programs in New York according to county, I found a histogram to be useful as well.  I then selected two free and easy-to-use data visualizations tools: Many Eyes and Tableau Public.

This brings me to the first lesson in creating data visualizations:

 (1) Don’t be seduced by the exciting and cool visualization tools: In creating visualizations for advocacy and social change, it’s critical to keep in mind your objective and to avoid visualizations which just offer eye-candy.   You want the reader to be attracted to your message, not your methodology or the cool visual tools you used.  So, ask yourself if you want your data to provide (a) description, (b) exploration, (c) tabulation, or (d) decoration (see Tufte’s “The Visual Display of Quantitative Information.” )   There is a lot you can accomplish visually with basic free tools such as the two that I used.  However, for a full list of all data visualizations tool available visit Bamboo DiRT.

(2) Prep your data: Every great visualization begins with a coherent and well-organized data set.  As a result, it’s important to clean your data and only leave the most essential variables organized in the best possible format to reveal the main relationships that you want to highlight between your variables.

Two free tools which can help you clean and prep  your data for visualization are:

For my data set of Local Mental Health Program in New York State, I filtered the data according to those that provided substance abuse counseling and then I created a frequency distribution with a pivot table.  Pivot tables (also called contingency tables and cross tabulation tables) are a powerful means of data visualization and data summarization.  You can download my pivot table here if you would like to experiment with it.

Mental Health Program Sub-Categories

Assertive Community Treatment Care Coordination
Clinic Treatment Comprehensive Psychiatric
Emergency Continuing Day Treatment
Crisis Day Treatment Education Forensics
General Hospital Psychiatric IP Unit General Support
Intensive Psychiatric Rehabilitation
Partial Hospitalization Personalized Recovery-Oriented Services
Private Psychiatric Hospital Residential Treatment Facility
Self-Help State Psychiatric Hospital
Support Program Treatment Program
Unlicensed Housing Vocational

Many Eyes provides information on how to format your data according to the visualization that you chose.
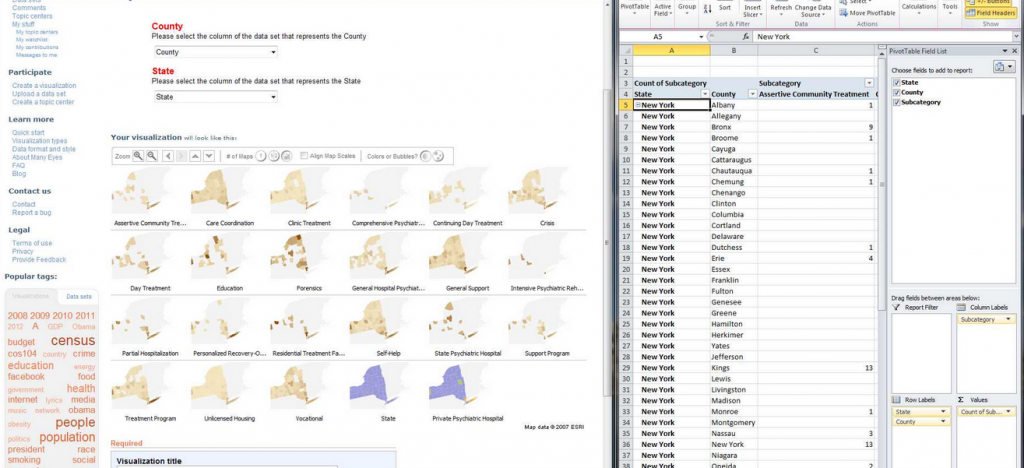
Pivot Table into Many Eyes

After creating a pivot table of my data which adds up the total number of program subcategories according to county in New York, I am then able to upload the data onto Many Eyes.
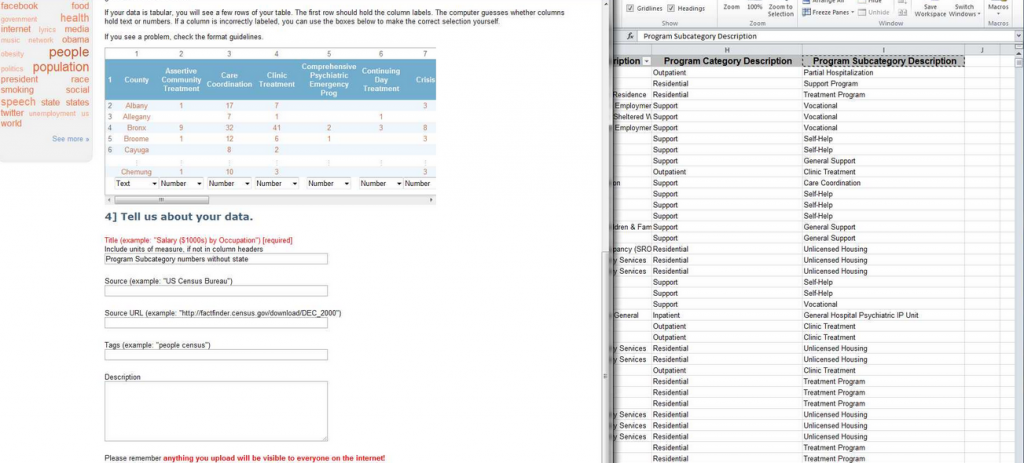
 finalizing pivot data

After uploading the data, I compared how the pivot data appears on Many Eyes versus my spreadsheet to ensure data accuracy.

To see the final interactive heat map designed on Many Eyes click on the image below:
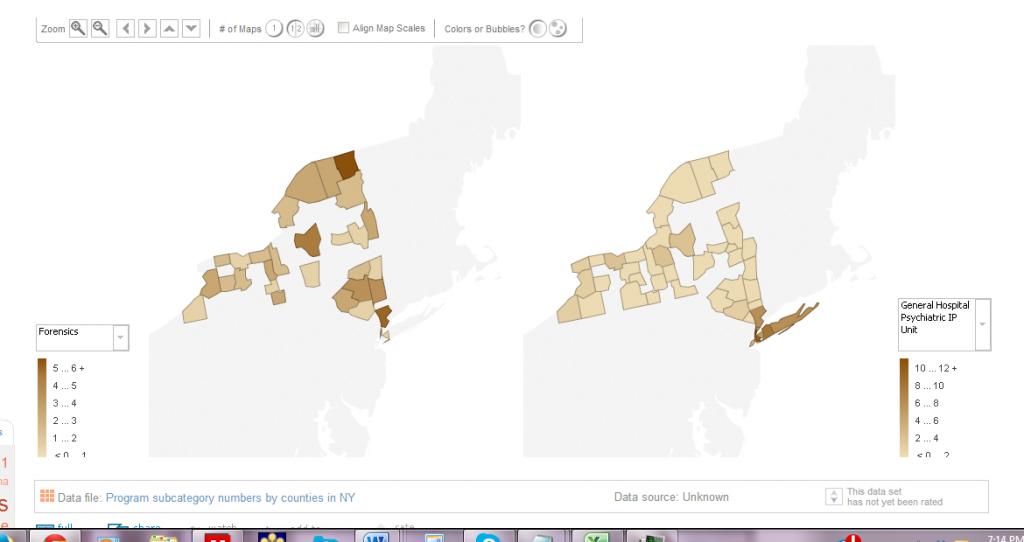
 Many Eyes Heat Map

 This heat map showcases the density of mental health programs that deal with substance abuse in New York State.  The heat map is interactive because the key allows you to select different sub-program categories to see which counties have the most programs and which don’t.  

(3) Ensure Content Focus: The best visualizations are transparent about the data used.  As a result, in designing my interactive heat map, I also included drop down menus for people to see what types of substance abuse programs were available in which counties and which were not.  As a result, I wanted to keep the focus on the content of the data and not necessarily on the very cool heat map that I just made!

(4) Reveal the data at several levels of detail, from a broad overview to the fine structure:  Tableau Public offers much more customization features which allow you to showcase your data on many different levels.
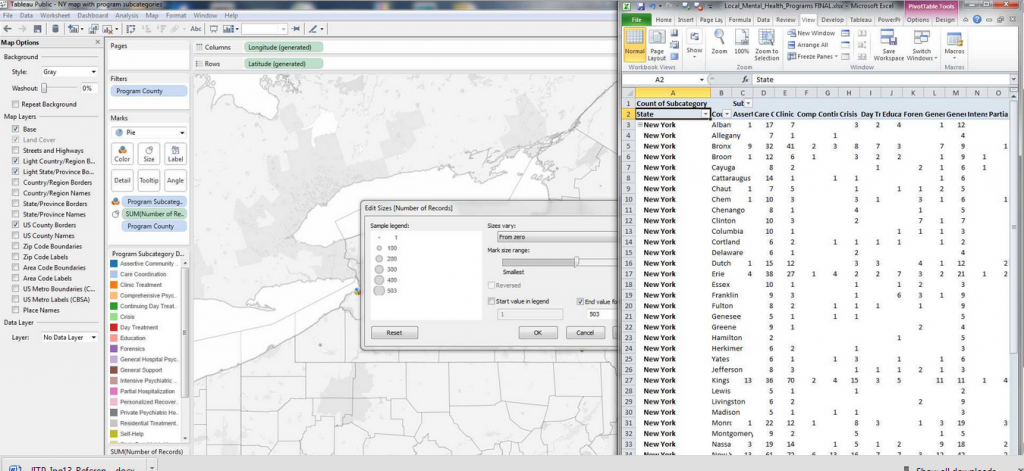
Tableau dashboard

Tableau dashboard features more options for organizing your data and highlighting specific trends geographically broadly or on a more granular level.  

(5) Avoid Distorting the Data: A good visualization should always showcase the data honestly.  As a result, things such as pie graphs and charts are frowned upon because they of their distortion of the data and lack of clarity.  This is what’s often deemed as avoiding “chart junk” (Tufte).

For example, my pivot table histogram below does a better visual picture of highlighting consistencies and gaps in mental health services across program sub-categories and counties than the map using pie charts.  
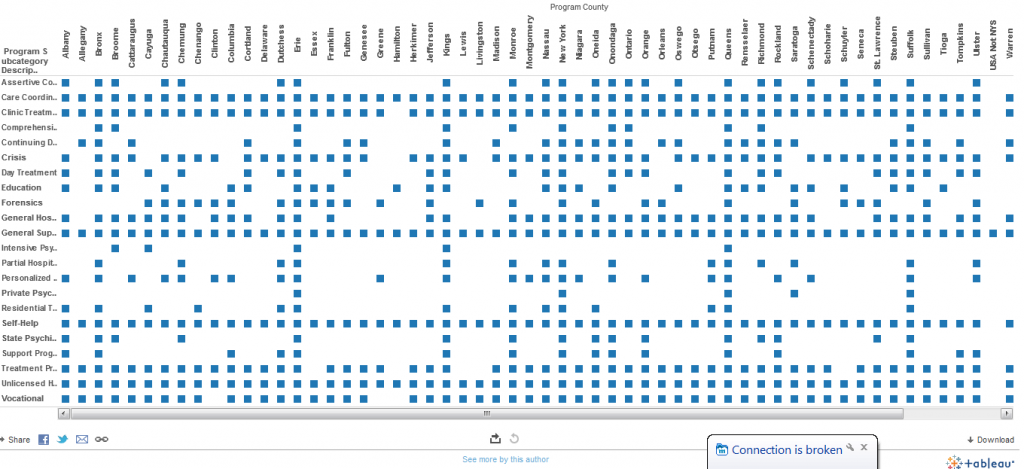
pivot table chart

Pivot table histogram highlighting the distribution of each mental health program sub category by counties.  As a result, this visual quickly shows you the overlaps as well as gap in services.

Now look at my same pivot table data but this time using pie charts rather than heat map or histogram.  Although, somewhat visually appealing, the pie charts do not shows how the programs each make up a whole, thereby, disguising the potential problems of overlap.
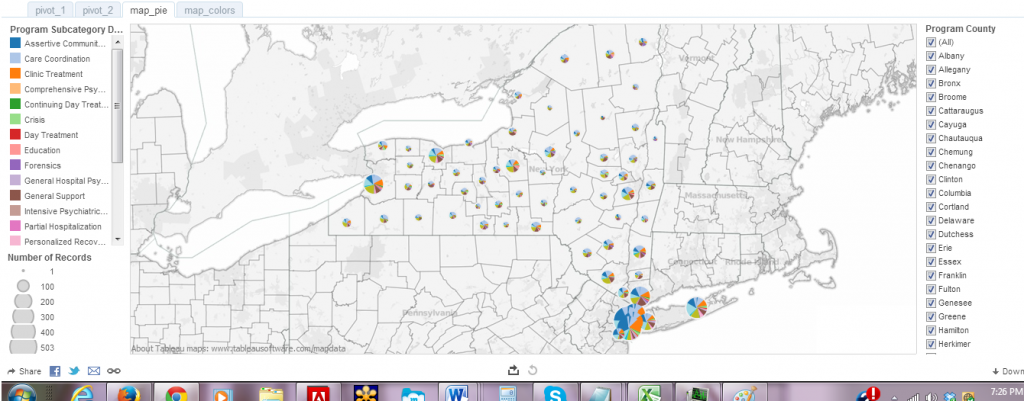
piegraphs

Becoming a Data Visualization Expert: Final Tips and Resources

 (6) Make it memorable:  Studies have found that memorability alone can enhance the effectiveness of visualizations.   A recent study, which is the most comprehensive study of visualizations to date, found that visualizations that were most memorable had:

  • Human recognizable objects”, these were images with photographs, body parts, and icons–things that people regularly encounter in their daily lives.
  • Effective use of color, specifically, visualizations with more than six colors were much more memorable than those with only a few colors or a black-and-white gradient.
  • Visual density, meaning that visuals that had a lot going on were more memorable than minimalist approaches.

For inspiration on data visualizations that promote advocacy and social change visit:

Shaping the Narrative through Arts and Technology: Youth Activism in Stop-and-Frisk

Youth activism in stop-and-frisk is often overlooked in mass media.  Much of the news regarding stop-and-frisk is centered on the class-action lawsuits filed by Communities United for Police Reform (CPR), a collective made up of several organizations, including  Center for Constitutional Rights, Make the Road-NY, New York Civil Liberties Union, Picture the Homeless and Bronx Defenders.

With the focus on these high-profile efforts to end stop-and-frisk, the individual and collective efforts led by youth are often overlooked.  These efforts at the local community level often include an array of micro-mobilizations such as “know-your-rights” campaigns, “cop-watch” projects, community meetings and video storytelling, as well as door-to-door advocacy, that are much less documented than the court cases which garner lots of press attention.  Considered together these community-based efforts demonstrate the ability of youth to advocate for neighborhood change.  

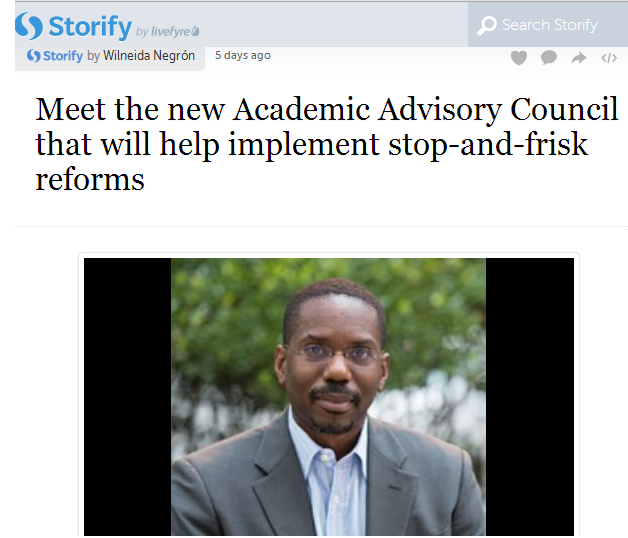
It’s been well documented that the communities most affected by the NYPD’s stop-and-frisk policing strategy are also characterized by low civic engagement and pessimism regarding the likelihood of neighborhood improvement (Rengifo & Slocum, 2011 in, “Police stops and community responses in the context of the New York crime decline“). The reality of youth mobilizations counter these prevailing ideas about these communities and demonstrate that the creativity and intelligence young people bring to these issues should not be overlooked. Particularly, as academics will be getting together to discuss deeper reforms (see the new Academic Advisory Council that will help implement stop-and-frisk reforms.)

Here’s just a short list of examples of some of these youth-driven and community-based responses to stop-and-frisk:

  • NLG-NYC Street Law Team, is made up of a group of law students from various New York City law schools.  These students meet with community groups throughout NYC and conduct free Know Your Rights: What to Do if You’re Stopped by the Police workshops.
  • NYC High School Youth from the Peapod Adobe Youth Voices Academy at Urban Arts produced, directed, and scored the documentary, Unreasonable Suspicion, which explores the causes and effects of stop-and-frisk.
  • 16-year-old NYC Black and Latino male, Cory Smith, created this photomontage which won first price at a Resilience Advocacy Project’s (RAP) “Youth Experiences of Stop-and-Frisk Told Through Art” contest.  The photomontange features a young man at the edge of the frame: he is seated facing its bottom left corner, shoulders hunched forward, hands folded in his lap.
stop and frisk nyc youth

Photo Credit: Cory Smith

These examples highlight two powerful lessons for the Academic Advisory Council and for academics looking to further study stop-and-frisk:

(1) The arts and technology are powerful mediums for not only engaging youth, but changing narratives and helping often-marginalized voices be heard.   These two combined can help overcome some of the pessimism and low civic engagement that often affect youth in low-income neighborhoods.

(2) The youth voice should be integrated into the discussion of police reforms and community healing.  New research should consider innovative strategies to capture the traction of these youth-led movements and to help amplify their voice and impact.

If you are feeling inspired by these youth efforts, here are a few things you can do to participate in stop-and-frisk discussions and events:

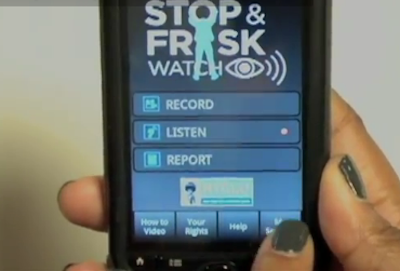
  • Have a Smartphone? Encourage everyone you know to download the Stop-and-Frisk app and report any instances of stop-and-frisk that you see in the community.
  • Are you on Twitter? Join the conversation and learn about local advocacy efforts by following these hashtags: #stopandfrisk, #Floyd, #communitysafetyact.
  • Work with youth? Contact NLG-NYC Street Law Tea at streetlaw@nlgnyc.org to set up a free “know your rights” workshop for your group. 
  • Feeling social?  Attend a local stop-and-frisk event and meet and collaborate with other activists.  This website features upcoming events: ChangetheNYPD.

For another discussion on youth involvement in stop-and-frisk, check out Morgane Richardson’s post on Envisioning A Better Future: Youth Action Against Stop-and-Frisk.  And for academics interested in getting involved in stop-and-frisk policy making, make sure to read, Julie Netherland’s post: Tips for Academics Who Want to Engage Policymakers.

“I’ve Been Stopped a Thousand Times”: Measuring Effects of Stop and Frisk

“I’ve been stopped a thousand times” – Black male survey respondent during the research conducted for Coming of Age with Stop and Frisk.

How do you measure the effects of stop-and-frisk on NYC youth, such as the survey respondent above, who report having being stopped more often than they could count or remember?

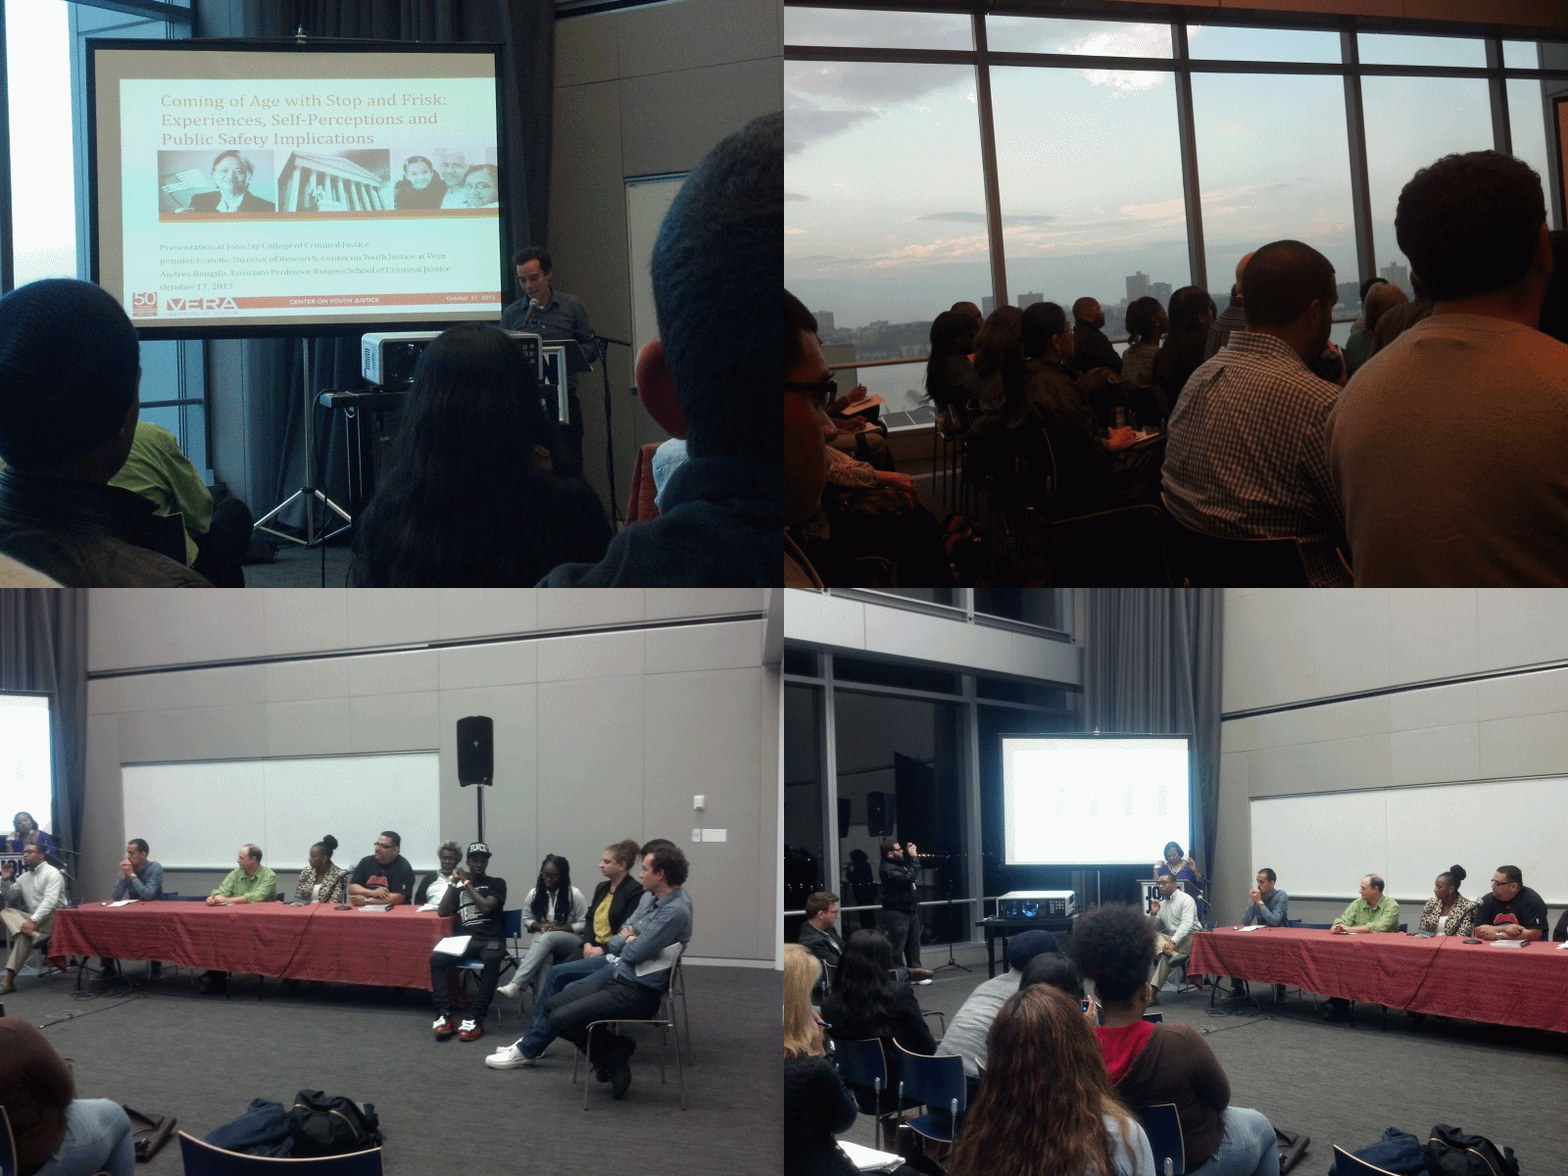
This was a pivotal challenge faced by researchers, Jennifer Fratello (Research Director, Vera Center on Youth Justice) and Andrés Rengifo (Associate Professor, Rutgers University) for their report Coming of Age with Stop and Frisk: Experiences, Self-Perceptions, and Public Safety Implications which attempts to capture the effects of stop-and-frisk.  During a recent event organized by The Center on Race, Crime and Justice at John Jay College-CUNY on October 17th, Fratello and Rengifo discussed their research.

stop-and-frisk nyc academic advisory council

Now that the NYPD’s stop-and-frisk practice was rejected by U.S. District Judge Scheindlin, the debate has shifted from discussions regarding its effectiveness in reducing crime to the effect it has on the lives of those stopped (in many cases more than once). As activists seek deeper reforms in policing, public scholarship is once again called upon to inform this debate.

While conducting research, Fratello and Rengifo quickly found out that in order to capture the broader effects of stop-and-frisk, they would have to learn to ask better questions and work with key government and community groups. The latter is particularly important, as they soon realized, none of the stakeholders (e.g., schools, police, public agencies, churches) were talking to each other.  During the October 17th meeting, panel speaker, Dr. C. Jama Adams discussed the importance of having greater institutional channels for communication among these stakeholders.  He mentioned that stop-and-frisk should be addressed holistically through a community-approach.  He feels this is the only way to address the deeply-rooted culture of “fearfulness” of which he finds Black males are often the scapegoat and which he feels stifles the individual creativity and spontaneity of all community members.    

Fratello and Rengifo faced challenges in capturing the instances of stop-and-frisk events in a respondents’ life.  In some instances, the sheer scale of the policing practice proved to be a problem. In piloting the survey, the researchers discovered that they would have to modify their questions to account for multiple stops. For those people who were stopped more than once, they either asked them to talk about the last time they were stopped or their most memorable stop. Yet, even when conducting research in neighborhoods with high rates of stop-and-frisk occurrences, the researchers were not able to meet their data collection goals for two neighborhoods – Jackson Heights and South Bronx – even after adjusting their research questions and approach.  In both of these areas they found that in general, people seemed reluctant to speak with outsiders about the police.  However, in Jackson Heights they faced the additional challenge that the majority of residents (65%) are foreign-born and may have an added apprehension of talking with “outsiders” (Coming of Age with Stop and Frisk: 11).

In other words, the very nature of stop-and-frisk makes it hard to measure its effects.  The reason for this is that those most victimized have a general apprehension over being approached by strangers, especially to discuss involvement with the police.

vera institute study
Coming of Age with Stop and Frisk: Experiences, Self-Perceptions, and Public Safety Implications at John Jay College-CUNY, October 17, 2013.  (Photo Credit: WNegron)

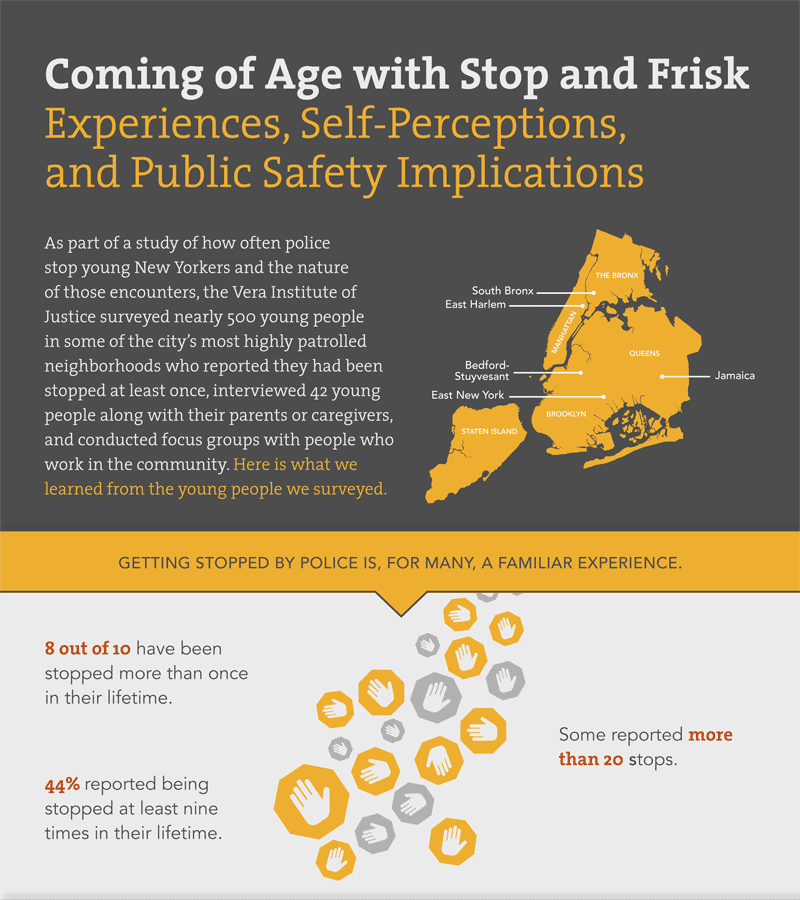
Despite these challenges, Fratello and Rengifo were able to uncover some of the corrosive effects of stop-and-frisk policing, especially on young people. They found that among the young people most stopped (between the ages of 13 and 25), trust in law enforcement is disturbingly low.  

  • 88 percent of young people surveyed believe that residents of their neighborhood do not trust the police.
  • Only four in 10 respondents said they would be comfortable seeking help from police if in trouble.
  • Young people who have been stopped more often in the past are less willing to report crimes, even when they themselves are the victims. Each additional stop in the span of a year is associated with an eight percent drop in the person’s likelihood of reporting a violent crime he or she might experience in the future (Coming to Age with Stop and Frisk: 89).

These findings present several troubling public safety implications.  For one, this population is most at risk of future victimization, therefore, its worrisome to consider they may feel like they have no where to turn if victimized. Secondly, they are also the ones for whom law enforcement needs to connect with in order to solve crimes and significantly improve safety in these neighborhoods.

Previous studies have found a similar level of distrust of law enforcement among urban youth of color.  In a series of qualitative interviews with urban youth in the United States, Canada, and Australia, Ruck and colleagues document that these young people were not only concerned about abusive treatment by police but were also resigned to it because they saw it as “inevitable and unlikely to change” (Ruck et al., 2008:20, “Youth experiences of surveillance. In M. Flynn & D.C. Brotherton).  However, other studies have shown that distrust of law enforcement can be spread through social networks and does not necessarily require direct contact with the criminal justice system (Menjívar & Bejarano, 2004, “Latino immigrants’ perceptions of crime and police authorities in the United States: A case study from the Phoenix Metropolitan area“). Clearly, this highlights the need for more research to discern between other factors which could give rise to distrust of law enforcement.  

stop and frisk nyc,

(See full infographic here)

Fratello and Rengifo include a set of timely recommendations in the Vera Institute report aimed at restoring trust and improving police-community relations. Most relevant for academics is their recommendation for the NYPD to partner with researchers to better understand the costs and benefits of various proactive policing strategies meant to replace stop-and-frisk.

Although academic-police partnerships are not new and reflect a growing trend toward “evidence-based” practice, it is not a relationship which comes easily for either police or researchers. In the article, “Partnerships with University-Based Researchers,” in a 2009 edition of The Police Chief Magazine, Sanders notes that although partnerships between law enforcement leaders and academic researchers have achieved much success and demonstrate long-term benefits for both, “only a small number of law enforcement agencies have actually reaped the benefits of research partnerships” (Sanders, 2009).   Other scholars describe these partnerships as filled with mutual misunderstanding that negatively impacts police-academic relationships and practices (Bradley and Nixon, 2009: “Ending the ‘dialogue of the deaf’: Evidence and policing policies“).

This research raises serious questions about the prospects for success of the proposed Academic Advisory Council, proposed by Judge Scheindlin.  This council is intended to engage in a community-based remedial process to develop sustainable reforms to the stop-and-frisk practices of the NYPD.” Scheindlin recruited Brooklyn Law School Professor I. Bennett Capers to be chair of the council, along with a dozen law professors from Columbia, Yale, Fordham, City University of New York (CUNY), Rutgers and Hofstra law schools, all of whom will serve in a pro bono capacity.

Although this Academic Advisory Council will set to play a large role in informing and shaping further police reforms, it is worth noting that other police-academic efforts at reform are underway.  One important new initiative is The Center for PolicingEquity.org, which seeks to promote police transparency and accountability by facilitating innovative research collaborations between law enforcement agencies and social scientists.

The Vera Institute report, Coming of Age with Stop and Frisk, by Fratello and Rengifo is a significant contribution to understanding the effects of stop-and-frisk policing, and there is much work to be done in documenting the effects of this practice, and in charting a new way forward.  The ruling by Judge Scheindlin makes it clear that the future of New York City is one without stop-and-frisk.  Academic researchers who are interested in this issue have a unique opportunity to help shape this future.


5 Steps for Counter-Storytelling Using Storify

Storify is an online tool which can be used to compose digital counter-stories to challenge racism, sexism, classism and promote social justice.

Why is Storify one of the best online tools for counter-storytelling?  Part of the reason is that it’s built into the software

“Our goal is to amplify the voices that matter by enabling our users to make sense of what people are reporting on social networks, to find meaning and provide context.”

However, it’s important to keep in mind that Storify is only a tool. This means the critical job for academic and digital activists is to (1) research and identify the online voices that need to be heard and (2) provide the meaning and context to those voices.

What is counter-storytelling?

Counter story-telling stems from critical race theory, which began around the mid-1970s.  Solorzano & Yosso (2002) define counter-storytelling as “a method of telling the stories of those people whose experiences are not often told” (p. 26).  So, counter-stories can be used to expose, analyze, as well as challenge deeply-entrenched narratives and characterizations of racial privilege, sex, etc.  In this sense, counter-stories can help promote social justice by putting a human face to the experiences of often-marginalized groups.  This promote their sense of social, political and cultural cohesion and teaches others about their social realities.

storytelling (cc: Flickr)

With that been said, counter-stories don’t always need to be created in direct response to majoritarian stories.  In fact, some scholars warn that “by responding only to a standard story, we let it dominate the discourse” (Ikemoto, 1997; Delgado, 1989). Therefore, the simple sharing of views and experiences of someone outside of dominant culture can be enough to create a new narrative (Williams, 2004).

When gathering individual stories to form a counter-story, scholars suggest the importance of maintaining theoretical and cultural sensitivity (Solorzano and Yosso, 2002; Strauss and Corbin, 1990; Bernal, 1998).  Theoretical sensitivity refers to the special insight and capacity of the researcher to interpret and give meaning to data (Strauss and Corbin, 1990). Cultural sensitivity (Bernal, 1998) refers to the capacity of individuals as members of socio historical communities to accurately read and interpret the meaning of informants (Strauss and Corbin, 1990).

An example of counter-storytelling includes Josh Stearn’s Storify tracking of reporter arrests at Occupy demonstrations. Stearn’s effort was named the Best Storify of 2012, and it has the kind of written narrative and contextualization that brings depth and structure to his topics.

Another example is from The Gates Foundation which produced an exemplary Storify called, “Voices of Change: A trip through Dharavi” that incorporates video, images, and short and insightful narrative to walk the reader through the life and people in one of the largest slums in the world.

And, the Storify of The Gay Girl In Damascus That Wasn’ttells the compelling story of “Amina Abdallah Arraf,” a the supposed Syrian-American woman involved in the Arab uprisings who it was later revealed was actually a man living in the UK.

5 Steps for Counter-Storytelling Using Storify

1. Draft story first – then search and aggregate online media content.

Before you start aggregating the online content, make sure you outline your story.  This extra step will add depth to your work and provide much needed context for readers of your Storify.  A common way to begin developing a counter-story is by finding sources of data, existing literature on topics, or from your personal experiences.  Storify allows you to write an opening paragraph and narrative transitions between the social media elements you pull in, so you can then begin crafting an outline of your story in this manner.  More here on how to craft a counter-story.

 2.    Make sure you have accounts for all the major social networks.

In order to make it easy to drag and add content from an array of social media sites, make sure you have accounts for all the major social networks.  The popular ones are Twitter, Facebook, YouTube, Flickr, Instagram, Pinterest, and Google+.  However, two other good social media sites I like to use: Soundcloud and RSS feeds.  Soundcloud is especially useful for counter-story telling as you can incorporate short interviews, songs, narration, etc. to showcase first-person narratives in the community.   

social networks

(cc: Flickr)

3. Use hashtags and keywords to find story content.

Hashtags and keywords are the easiest way to find relevant social media content.  Make sure to check out current hashtags on Twitter so that you can pull in content linked to current tags. If your counter-story features a specific geographical location, use Trendsmap to locate the most popular trends and hashtags for that area.  Trendsmap can also help you find interesting and relevant local news.  Lastly, remember you can search for multiple hashtags and pull that content into the same story.

If you would like to use your counter-story to promote mobilization around a certain issue, consider creating your own hashtag and then asking individuals from the group you are showcasing to share stories online via that hashtag.  Your job then is to collect these stories on Storify and share them with the world!

4.   Quote direct sources and add first-person accounts.

One of Storify’s strengths is its ability to portray online conversations as they unfold, instead of confining them to a static report or document.  Therefore, be selective about the voices you highlight.  Reach out to the people whose social media voice you are featuring and let them know you are using their content.  Overall, you will find most people are enthusiastic and supportive.   Also, studies have found that if you quote influential people on Twitter they will retweet you!

5.    Embed an interactive map to engage your readers

In social media lingo, interactivity = increased engagement.  Therefore, rather than limiting your counter-story to a series of updates and pictures, consider adding some interactive elements of social media.  One of the most common is an interactive map that readers can click through to find any relevant points of interests, local community news, or any other useful information related to your counter-story.  For instructions on how to create an interactive map for Storify, click here.


Opportunities for Digital Activism: How Social Movement Repertoires, Data, & Community Partnerships Provide Them

Lessons from the Birth of the “Stop and Frisk Watch” App

I recently reached out to the New York Branch of the American Civil Liberties Union (NYCLU) in order to find out more about their new “Stop and Frisk Watch” app for IPhones (available in English and Spanish) and Androids (only in Spanish).   This app appeared to be a perfect unison of grassroots activism and digital technology in addition to being a good example of how digital technologies can alleviate a social injustice.  As I later found out from the NYCLU Communications Director, Jennifer Carnig, the way that this app came to fruition also provides important lessons for academics trying to incorporate digital technology into their research and/or activism.

Background

The stop-and-frisk practices of the NYPD having been troubling academics, community groups, and digital activists alike.  Just two weeks ago, Dr. Michelle Fine and Dr. Maria Elena Torre spoke at the participatory, open, online course “POOC”: Reassessing Inequality and Reimagining the 21st Century: East Harlem Focus, on their participatory action research study of the NYPD’s “Stop and Frisk”.

Stop and frisk raises grave concerns over racial profiling, illegal stops, and privacy rights.  You only need to take a closer look at the NYPD’s own facts and figures to notice a troubling pattern.  Looking at NYPD data reveals that among the thousands of law abiding citizens that are stopped every year, the majority of them are black and Latino.  Last year alone – of the 533,042 New Yorkers that were stopped:

  • 89% were innocent
  • 55% were black
  • 32% were Latino
  • 10% were white

The Stop and Frisk App

With this persistent and growing concern, NYCLU seized the opportunity to partner with a Brooklyn-based visual artist and software developer, Jason Van Anden.  Van Anden was the developer who had previously created the Occupy Wall Street app, “I’m Getting Arrested.”  Together the NYCLU and Van Anden set to create an app that would provide New Yorkers with the tools needed to monitor, report police activity, and hold the NYPD accountable for unlawful stop-and-frisk encounters and other police misconduct.

The app currently allows New Yorkers to:

(1)   Film an incident with audio which after being submitted would go to the NYCLU for review.

(2)   Receive alerts of when people in their area are being stopped by the police.  This is an important feature for community groups who monitor police activity.

(3)   Report a police interaction they saw or experienced, even if they didn’t film it.

(4)   Learn about their rights when confronted by the police through “Know Your Rights” resources that instruct people about their rights when confronted by police and their right to film police activity in public.

stop and frisk app nyclu

(cc Capital New York)

 Lessons for Seasoned and Aspiring Academic Digital Activists

1)  Pay close attention to current trends in social movement offline and digital repertoires of contention.

The New York Civil Liberties Union developed this app as a result of what they dub, “intersection between crisis and opportunity”. During the height of Occupy Wall Street, the NYCLU kept getting press calls about an app called I’m Getting Arrested, which allowed Occupy Wall Street protesters to send a text message to select people to alert them that they were getting arrested.  The NYCLU loved the app and immediately thought about all of the ways that same technology might be useful to deal with the issue of unlawful stop-and-frisk practices among young black and Latino men in New York City.  They reached out to Van Anden to discuss possible collaborations and he was immediately sold on the possibilities of bringing technology to social justice.

2) If the data presents a disturbing trend – don’t just report the trend.  Also, consider and propose ways that free and easy to use digital tools can empower your population of interest to take matters onto their own hands!

The NYCLU noticed a disturbing trend since 2011.  During this time, they saw that police street interrogations were skyrocketing. Over the course of the Bloomberg administration, stop-and-frisks had gone up more than 600% – from 97,000 in 2002 to nearly 700,000 in 2011!  Concurrently, 9 out of 10 people stopped are eventually found innocent, and as noted earlier more than 85% of people stopped are black or Latino.  The NYCLU thought it would be empowering for New Yorkers to have a free, easy way to fight back, using the one tool that most people have in their pockets all the time – a smartphone.  Stats show that two-thirds of young adults own smartphones. This technology clearly has the power to help change the way we look at and understand the world around us.

3) Always embed your research and digital activism within grassroots networks and grassroots realities

In putting this app together the NYCLU relied on their network, Communities United for Police Reform, of which they are part of the steering committee.  This allowed them to get much needed feedback and support from other member organizations who were either formally or informally involved with developing, testing or sharing information about Stop and Frisk Watch. They also noted that Justice Committee and its Cop Watch groups have been particularly helpful in testing and their members are using the app themselves as they observe the police.  At the same time, they partnered with NYC immigrant social justice group, Make the Road by Walking, who translated their app into Spanish.

4)  Although the digital divide is alive and very much real, make sure to understand the technology trend among your target population

In choosing to develop an app, the NYCLU was well aware that 2/3 of young adults own smartphones; by 2013, 3 out of 4 Americans who acquire a new mobile phone will choose a smartphone; and 72% of smartphone owners will be between 24 and 35. This age range is the perfect demographic for the NYCLU to reach as it is this same group that is being targeted by the police and as such the most likely to use the app.  They also designed the app so that it would be extremely easy to use and hope that its usability will turn passive observers or other disenfranchised by this disturbing trend to become empowered community-problem solvers.


Becoming Public: Academic Blogging as a Tool for Activism and Community Engagement

A recent feature on the London School of Economics (LSE) blog, asked a question which has been plaguing the academic community for over 10 years: Why are so many academics against academic blogging?”  There is much anecdotal evidence as to the reasons why academics refrain from blogging.  They include concerns that academic blogging:

  • Demeans or cheapens scholarly work
  • Can become misconstrued, misunderstood, and misused to fit narrow political or social agendas as it enters the public realm.  This may threaten the autonomy of academic work.
  • Takes too much time and so, takes away from “more legitimate academic activities”.
  • Leads to internalized self-censorship that comes with years of enforced academic perfectionism
  • Can hurt the academic and professional prospects of a scholar

Looking at these concerns it’s clear that academics have to mediate between the discomforts and concerns that surround academic work and the public realm. Academic blogging is merely one of the common ways that academia life intersects with the publics. LSE argued in their article above, “Academic blogging exists somewhere in an ether space between academic research and broader community.”  It is the space where academic research is made more accessible and so facilitates a more democratic relationship between academics and various publics.”  

And who is most equipped and suited to overcome these challenges and provide further definition and insight into this ether space – than academics themselves!  Many academics are trained in ethnographic and field work methods which prepare them to act as brokers and mediate between two worlds.  These are the same skills that can be used in order to merge the academic with the public and lay the groundwork for channeling  academic blogging towards activism and community engagement.

 photo ethnographicresearch_zps7999a203.jpg
(CC Image from Flickr)

Last week was the launch of CUNY Graduate Center’s first participatory, open, online course “POOC”: Reassesing Inequality and Reimagining the 21st Century: East Harlem Focus.  The speakers Dr. Michelle Fine and Dr. Maria Torres shared personal experiences conducting participatory action research (PAR) in regards to stop and frisk policy issues in NYC communities. Their talk described and emphasized the mutual reliance that academics and the communities they study have to foster and grow a shared learning process.  Academics have learned though years of hard lessons out on the field; to juggle the ethical demands and principles of their scholarly community with those that arise when they embed themselves in the lives and communities they seek to study.  Like in most types of field work research, as the mediation process is introduced, there are risks of misrepresentation, misinterpretation and exaggeration that may arise.  However, in field work we have learned to persevere and overcome these challenges. Why can’t the same difficult, long, yet rewarding learning process take place, as it is now academics and their work, ideas, and thoughts which are placed under the microscope of public scrutiny and for public consumption? The basis of much of academia is to bring people together across these boundaries, ideas, and beliefs – and we should be committed to contributing to this shared learning process.

So, my hope is that by acknowledging the difficulty of “becoming public” we can set ourselves on a path to identifying lessons we have learned in our own research and work that can help us move on and “get over it.”

With that being said, embracing a culture of connectivity is not for every academic. However, there has never been a better time to be a public intellectual thanks to the abundance of technology and digital tools available.  And as this article argues – academics are among the best equipped to help forge that path.