Category Archives: News

Roundup of Responses to Kristof’s Call for Professors in the Public Sphere

Nick Kristof, columnist for the New York Times, published an op-ed on Sunday pointing out the need for professors in the public sphere. His criticism is basically that most academics are not engaged in ‘today’s great debates’:

Some of the smartest thinkers on problems at home and around the world are university professors, but most of them just don’t matter in today’s great debates.

The most stinging dismissal of a point is to say: “That’s academic.” In other words, to be a scholar is, often, to be irrelevant.

Lots of academics immediately jumped on Twitter using the hashtag #engagedacademics (still going strong) and let Kristof know what they thought he got wrong, primarily that many of us are (already) engaged and we’re doing it through Twitter. Kristof replied via his Facebook page, saying (in part):

One objection is that in fact there are lots of professors on Twitter. Sure, but there are 1.5 million professors in America, and not nearly enough throw themselves into public engagement.

Basically, the Twitter critics of Kristof came down around a ‘cast a wider net for how you define engagement’ argument, such as this comment from Professor Blair Kelley (@profblmkelley):

ProfKelley_Tweet

The print edition of the New York Times has the letters to the editors they selected to respond to Kristof (I see mine didn’t make it), with a range of critiques suggesting:

  1. more user-inspired, policy-relevant research (Gromes),
  2. cast a wider net for defining engagement (Sugrue),
  3. change the outputs of scholarly research to include forms intended for public audiences (Iglesias)
  4. this is an old attack on academics and is anti-intellectual (Steinberger)
  5. think tanks are the answer, though even think tanks have a hard time finding academics who can speak to a broad audience (Selee).

A number of #engagedacademics  took to longer-than-140 blog post form to post their critiques of Kristof.  Here’s a roundup of what they had to say, organized very broadly by key arguments (of course, many posts make several arguments, so please do read the linked posts for more nuance than this bulleted list summary).

What academics need is more online navel-gazing: 

This is an old criticism:

  • Sarah Chinn, The Public (Anti-)Intellectual :  But beyond the specifics of whether academics do or don’t have anything to say in the public square, I’m more interested in the theme itself, which seems to reappear every now and then. In a nutshell, it’s this: oh you eggheaded academics! Why can’t you talk to the common person about interesting things? This is hardly a new development. Richard Hofstadter wrote the groundbreakingAnti-Intellectualism in American Life in 1966, for God’s sake, and he traced complaining about people who think they’re smarter than everyone else back to the very beginnings of the American Republic.

  • Pat Thomson, academics all write badly..another response to a familiar critique: In the UK context, Kristof’s argument seems like a very cheap shot indeed. Another go at academics for being obscure and difficult. Yes, we all write the odd arcane paper and yes, it is rewarded and yes, it might only be read by three people. But we also try really hard to write other things too. Today’s academic writes and publishes for a range of audiences. What’s more, and by the way, I thought mentally wagging my finger at Kristof, the UK academy and the public are not as easily cut apart as that.

It’s the reward structure:

  • Austin Frakt, “Publish and Vanish”: academics are generally not directly rewarded professionally for translation and dissemination work, particularly via new and social media. Promotion and tenure is usually based on number and prestige of scholarly publications, classroom teaching, and “service” (e.g., roles on institutional committees). Of these, publishing is the most uncertain and angst-ridden process. “Publish or perish,” is a familiar characterization. But, if by publishing only in obscure academic journals, one disappears from broader, public view, perhaps we should say, “Publish and vanish.”

  • Syreeta, UofVenus/Feministing: Above all, his column and subsequent blog post just seem so out-of-touch with the machine of the academy. There are real-life economic interests that drive our intelligentsia towards publishing “gobbledygook…hidden in obscure journals,” which are inextricably linked to a very powerful interest by said academics in securing full-time employment. People need jobs, my dude! And publication is a critical motivator and performance metric for the academic seeking tenure at any private or public institution. Compounded by the rising cost of tuition and the painful underfunding of scholarly research (the social sciences in particular), these spots for long-term employment are coveted; in March, a vote led by Senator Coburn barred funding for scholarly research in political science that doesn’t promote national security or economic interests. Colleges cut tenure lines for departments with a frequency that I’m not able to quantify. Add as a multiplier the growing adjunct specialized labor underclass, highly competitive and woefully underpaid posts for emerging academics seeking entry into the academy, who also have to write and publish to gain visibility and survive.

  • Christine Cheng, Academia and Incentives: The core problem is one of incentives within academia: Academic prestige/tenure/promotion is based purely on publications. On the surface, this seems like a fair way of gauging merit. But it means that everything else that professors do tends to run a distant second (teaching, administration and service, public engagement). Given the fierce competition for academic posts these days, no one is going to give up their research time for public engagement (unless s/he enjoys doing it if they don’t already have tenure.

  • Stephen Manning, Transforming Academia: There might be another, underutilized way of making academia more progressive and impactful: hiring and promotion policies. Many of us scholars are involved in recruiting new PhD students and faculty every year. And oftentimes – let’s be honest – it comes down to a simple question: can this person publish or not? It should be obvious that this selection mechanism will reproduce the very mindset that prevents academia from making a more important impact in this world. Instead, I propose that hiring should be guided by: academic interest, mindset and experience outside academia.

  • Janet Stemwedel, Scientific American: “…ignores that the current structures of retention, tenure, and promotion, of hiring, of grant-awarding, keep score with metrics like impact factors that entrench the primacy of a conversation in the pages of peer-reviewed journals while making other conversations objectively worthless — at least from the point of view of the evaluation on which one’s academic career flourishes or founders.”

I would, but I’m teaching four classes (variation on reward structure):

  • Laura Tanenbaum, Jacobin: As one of those professors teaching four classes at a community college, I do wish I had more time for my (perfectly lucid if I may say so) writing, but I also have a crazy idea that teaching hundreds of working-class, immigrant, and first generation college students every year might be a way of serving the public. I didn’t realize the only way to do that was to be a consigliere.”

We’re already here (variation on ‘cast a wider net’):

  • Erik Voeten, MonkeyCage: Yet, the piece is just a merciless exercise in stereotyping. It’s like saying that op-ed writers just get their stories from cab drivers and pay little or no attention to facts. There are hundreds of academic political scientists whose research is far from irrelevant and who seek to communicate their insights to the general public via blogs, social media, op-eds, online lectures and so on. They are easier to find than ever before. Indeed The New York Times just found one to help fill the void of Nate Silver’s departure. I am with Steve Saideman that political scientists are now probably engaging the public more than ever.

  • Erica Chenoweth, A Note on Academic (Ir)relevance: This is the part that surprised me the most about Kristof’s article: the supposition that our work is only relevant if it directly influences “important people.” But what if one’s work speaks to people outside of these traditional halls of power? Is such impact irrelevant? For example, many sociologists, whom Kristof writes off as a bunch of radicals who are hopelessly lost of any relevance, tend to be quite engaged with the problems of our day — just not in the way Kristof seems to privilege. Just check out Sociologists without Borders, or different proponents of applied sociology, and you will find that many sociologists work tirelessly (and often without compensation) to draw on the insights of their work to improve the lives of ordinary people.

Kristof things the category ‘public intellectual’ is only for white dudes: 

  • Raul Pacheco-Vega, Challenges of Public Engagement for Marginalized Voices: he reason that prompted me to write this post was the repeated process where the pieces most retweeted and engaged upon (even by Kristof himself) were those of white males. You could always say that it was only those academics who took it upon themselves to write a piece in response, and I’m grateful that they did. But there were several women who wrote very smart take-downs of Kristof’s column, and I saw less conversation and publicizing of those while I followed the conversation on Twitter.

Marginalized people are to be saved, not speak for themselves: 

  • Corey Robin, Look Who Kristof’s Saving Now:  I don’t ever expect Kristof to look to the material sources of this problem; that would require him to raise the sorts of questions about contemporary capitalism that journalists of his ilk are not inclined—or paid—to raise. But Kristof’s a fellow who likes to save the world. So maybe this is something he can do. Instead of writing about the end of public intellectuals, why not devote a column a month to unsung writers who need to be sung? 

Some practical advice for how to be more engaged:

  • Robert Kelchen, What Can We Do?Work on cultivating a public presence. Academics who are serious about being public intellectuals should work to develop a strong public presence. If your institution supports a professional website under the faculty directory, be sure to do that. Otherwise, use Twitter, Facebook, or blogging to help create connections with other academics and the general public. One word of caution: if you have strong opinions on other topics, consider a personal and a professional account. Try to reach out to journalists. Most journalists are available via social media, and some of them are more than willing to engage with academics doing work of interest to their readers. Providing useful information to journalists and responding to their tweets can result in being their source for articles. Help a Reporter Out (HARO), which sends out regular e-mails about journalists seeking sources on certain topics, is a good resources for academics in some disciplines. I have used HARO to get several interviews in various media outlets regarding financial aid questions.

Oh, look, we’ve built an organization (or two) to connect scholars to the public sphere: 

  • Amy Fried and Luisa S. Deprez, Talking Points Memo: “…in 2009, when recognizing the gap between those researching possible solutions to pressing policy issues and those in power searching for such answers, Theda Skocpol, a world-renowned professor of government and sociology of Harvard University, led the charge with other top scholars like Jacob S. Hacker of Yale University, Lawrence R. Jacobs of the University of Minnesota, and Suzanne Mettler of Cornell University, to start the Scholars Strategy Network. The organization is a national association of professors and graduate students devoted to sharing their expertise with policymakers and the public to improve public policy and enhance democracy.”
  • An Open Letter from the Scholar Strategy Network.
  • And finally part of my, unpublished, letter to the editor in response to Kristof: PhD’s are rarely trained to be public intellectuals. Public engagement garners little reward in tenure and promotion structures that favor publication in journals largely out-of-reach to readers not affiliated with a subscribing university library. Last year, with Ford Foundation support, the Graduate Center, CUNY launched JustPublics@365, a project to connect academics with wider publics. More than 400 (with 1,000 more waiting) attended digital media training. More will train at the American Sociological Association meeting in August. Many professors want to engage more fully, they just don’t know how. It’s time for professors to go back to school, and it’s time for universities to reward public scholarship.

Still ruminating on Kristof’s provocation? Did I miss your favorite response? Post a comment.


JustPublics@365 Toolkit: Social Media Guide for Academics

Academics engage in research and produce knowledge that, intentionally or not, may inform progressive social change.  Digital technologies are making it easier for academics to connect their research with movements and community groups who trying to bring about social change.  However, many academics may still be perplexed about how to use social media.

JustPublics@365 is here to help meet this need, connecting academics and social change agents through social media.   Our toolkit, available in multiple e-book formats, is an easy way to get started.

toolkit cover

Get it three ways:

Journalism as Activism for Families Separated by Incarceration

After years writing technology articles for The New York Times and the Internet-only upstart News.com, I felt constrained as a journalist. I yearned to rekindle the inspiration that drew me to the field: covering marginalized communities and exploring new ways to report and share their stories.

Then in 2007, I met Alison Coleman, a woman who had struggled to support her two children while her husband served a 25-years to life sentence in a New York state prison for petty theft under the harsh Rockefeller-era drug laws. She told me that for years she had had nowhere to turn for social or emotional help. Her parents only said, “We told you so” for marrying a black man. She kept to herself at church fearing her congregation would reject her family.

While statistics and political attitudes about incarceration rates in America are closely tracked, the human stories of prisoner families—like Ms. Coleman’s—are virtually unknown to mainstream Americans because this exploding yet unaccounted population is viewed with suspicion and rejected as guilty by association.

I decided to launch a media project to create a geographic and digital community for prisoner families even as social stigma and iron bars conspired to keep them fragmented and fearful.

I came at this as a journalist with a perspective–to show Americans the social cost of imprisonment beyond the political or “get tough on crime” perspective.

I explored and shaped the contours of crowdsourcing (having the community you cover help you cover themselves) and collaboration. Before it became standard practice, I trained people to produce video and audio columns about their experiences. One 22-year-old woman shot a powerful video about spending her first Mother’s Day with her mother outside of prison. As she prepares a special dinner, the mother-daughter banter slowly turns into a tense exchange about the daughter’s feelings of abandonment. The video captures a moment in the fragility of their relationship.
Another novel concept I used was to post a Skype phone number and asked people to leave voicemail with their questions and experiences. I posted these on the site as audio clips. We hear one woman, for example, describe her struggle to care for a loved one as he undergoes cancer treatment in prison. Years later, newsrooms began to use the same technique to engage their audiences.

In all I’ve published nearly 150 multimedia pieces, which when viewed as a whole reveal the financial, social and emotional toll on prisoner families like no other news coverage has.

I’ve produced live Web radio shows–with a community member as co-host–on topics as diverse as finding a job after incarceration and coping with separation during the holiday season when a family member is imprisoned. I’ve posted finely edited videos, each delving into a discrete corner of people’s experiences. In one video, for example, a 14-year-old boy describes the difficulty of having a “perfect moment” with his father when a guard is always standing a few feet away, and his need for a strong father-son bond.

The project’s most pivotal success, however, relied on a fundamental aspect of reporting: persuading sources who feared stigma and worse to speak publicly about their situation. “Our words have been distorted so many times to fit sensational or superficial pieces on TV and in newspapers,” Coleman, wrote about Family Life Behind Bars. “But we came to trust you because you let us share our voices with each other and the world.”

As the project gained momentum, its work resonated with the community. Coleman, who founded Prison Families of New York, a networking group in upstate New York, said the site brings “together a mosaic of voices that let us learn from each other’s challenges and small emotional victories.

~ This post was written by guest blogger Sandeep Junnarkar, Associate Professor, CUNY Graduate School of Journalism. You can follow him on Twitter @sandeep_NYC.

Using Infographics to Shift the Debate on Gun Violence

Infographics, a blend of solid statistics and compelling graphic design, can help shift the debate on important social issues like gun violence. Our current series examines the ways that policy approaches rooted in criminalization might shift if they were re-framed as public health issues instead. In many ways, gun violence is the best example of how our criminalization has not solved a problem that seriously harms peoples’ health. As previous posts here have noted, the data on gun ownership and gun violence can be daunting. Infographics can help clarify what the patterns are, and what the harm to health really is, like this one:

Gun Violence in America

Explore more infographics like this one on the web’s largest information design community – Visually.

This inforgraphic was created using the web-based tool Visual.ly, which is among the best tools available for telling compelling stories with data.

The Interrupters: Public Health and Violence

The conventional response to violence has relied on criminalization, policing and longer prison sentences, yet violence persists. In 2011, Steve James released a documentary, The Interrupters, to capture the violent landscape of our cities through the eyes of “violence interrupters,” activists working in the tradition of non-violence to interrupt confrontations before they become violent. This documentary tells the story of three activists working to protect their Chicago community from the violence they once created.

The Interrupters, Trailer. 

The film’s main subjects work for an innovative organization, CeaseFire, founded by Gary Slutkin. Slutkin, an epidemiologist and physician who battled infections diseases in Africa, says that violence mimics infections like tuberculosis and AIDS. He believes that treatment for violence should follow the same plan as those for diseases: “go after the most infected, and stop the infection at its source.” Rather than thinking of violence from a moral issue (good people vs. bad people), Slutkin approaches violence from a public health one (healthful vs. unhealthful behavior).


Gary Slutkin, TedMed Talk. 

CeaseFire and the Violence Interrupters are part of an effort to apply the principles of public health to the violence of the streets. CeaseFire tries to deal with these quarrels on the front end through former gang members, or interrupters, who mediate criminal activity on city streets. They “operate in a netherworld between upholding the law and upholding the logic of the streets.

You can watch the full length documentary online here.

You may also read the interview with filmmaker, Steve James, here.

***

This post is part of the Social Justice Topic Series on From Punishment To Public Health (P2PH). If you have any questions, research that you would like to share related to P2PH or are interested in being interviewed for the series, please contact Morgane Richardson at justpublics365@gmail.com with the subject line, “P2PH Series.”


Guns and Suicide: A Public Health Crisis

Guns, the most lethal means of committing suicide, represent a public health crisis.

Most imagery conjured up by the idea of gun violence in the national debate involves on one end, a bad person with a gun, and on the other end, another person scared senseless by the bad person with the gun, waiting for the cavalry.

But the numbers paint a different picture – one that continues to prove difficult to digest for folks on both side of the debate .  In fact, suicide is the leading type of firearm death, and teenagers, young adults, and males aged 75 and older are currently at the highest risk for this type of death. According to the CDC, suicide is now the third-leading cause of death for teenagers.

Of the 100 people who take their own lives every day in America  – that’s almost – 40,000 deaths a year –  most use a firearm.  More people choose a firearm over all other intentional means combined, including hanging, poisoning or overdose, jumping, or cutting. But Americans are not more suicidal than the citizens of other comparable countries (populous, wealthy). They just have more access to the most lethal means of committing suicide. A gunshot is an irreversible response to what is often a passing crisis – possibly worsened by the temporary depressive fog of alcohol. Suicidal individuals who take pills or inhale car exhaust or use razors have time to reconsider their actions or summon help, but gunshots are merciless game-changers.

prviate guns public health

According to the Harvard Injury Control Research Center, the states with the three highest suicide rates (Wyoming, Montana and Alaska) are also the top gun-owning states, and researchers agree that bringing a gun into the home not only increases the risk of gun-related accidents, but also the risk of suicide. Specifically, that research finds:

“Gun owners and their families are much more likely to kill themselves than are non-gun-owners. A 2008 study by Miller and David Hemenway, HICRC director and author of the book Private Guns, Public Health, found that rates of firearm suicides in states with the highest rates of gun ownership are 3.7 times higher for men and 7.9 times higher for women, compared with states with the lowest gun ownership—though the rates of non-firearm suicides are about the same. A gun in the home raises the suicide risk for everyone: gun owner, spouse and children alike.”

It is perhaps time, then, to abandon the myopic view that those who would take their own life are not influenced by the availability of suicide methods, and accept that whether or not they survive is dictated primarily by how they choose to go about it. About 85 percent of suicide attempts with a firearm end in death (drug overdose, the most widely used method in suicide attempts, is fatal in less than 3 percent of cases.)

Research on suicide by the Harvard Youth Violence Prevention Center has also shown that one of the biggest myths is that suicides are typically the result of careful advance planning. While this may be the case — individuals who attempt suicide often succumb to a complex series of problems — empirical evidence suggests that they act impulsively in a moment of heightened vulnerability.

While the recent enactment of the Mental Health Parity Rule (which will guarantee that most insurance coverage offers access to mental health services on par with physical health coverage) brings hope to many whose lives would be vastly improved by access to mental health services, the collection and study of gun-related data has been severely undermined in the past two decades, and with it a crucial means of pushing forward sensible gun policies.

Despite President Obama’s reversal earlier this year of the NRA-sponsored amendment that barred the CDC from studying the causes and prevention of gun violence, researchers are still unable to answer many key questions such as the number and distribution of weapons across the country – slowing down prospects for life-saving policy reform. So much grief could be softened, if not avoided, by addressing the public health crisis of guns and suicide.

~ This guest blog post was written by Alice Cini is a social justice advocate and Social Work Fellow at the John Jay College of Criminal Justice’s From Punishment to Public Health Initiative. You can follow her on Twitter @CinikAl.

***

This post is part of the Monthly Social Justice Topic Series on From Punishment To Public Health (P2PH). If you have any questions, research that you would like to share related to P2PH or are interested in being interviewed for the series, please contact Morgane Richardson at justpublics365@gmail.com with the subject line, “P2PH Series.”

Understanding Gun Violence in New York City: 10 Charts to Get You Started

Understanding gun violence in New York City requires both a macro and micro perspective.  Yesterday’s interview with scholar and trained epidemiologist Ernest Drucker, from Columbia’s Mailman School of Public Health, a Scholar in Residence at John Jay College of Criminal Justice, highlighted some of the broad and underlying issues related to drugs and race and ethnicity in New York City.  

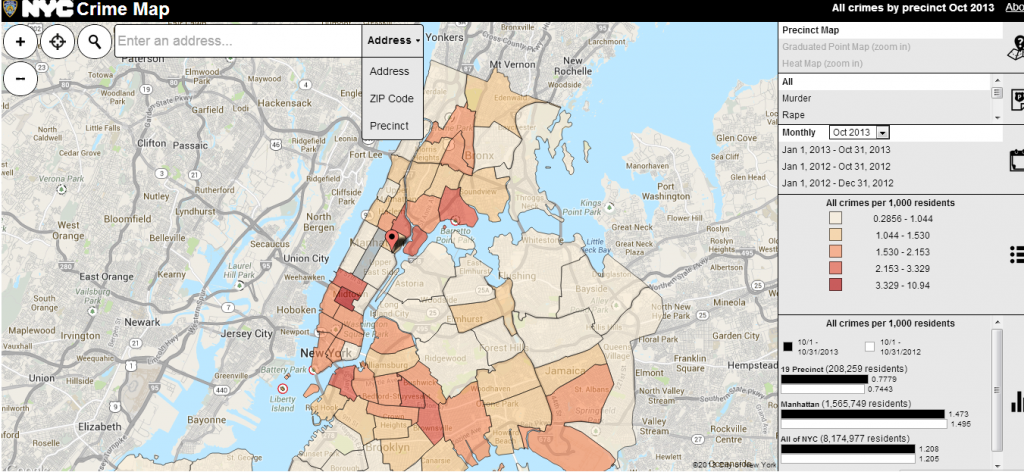
Recently, the NYPD released a an interactive Crime Map that allows you to see the instances of crimes as a heat map shaded by precinct when viewed zoomed out, and by graduated points when zoomed in.

NYC Crime Map  

Using data and charts from the Neighborhood Crime and Drug Project, directed by John Jay Faculty in the Department of Anthropology, Ric Curtis, Josh Eichenbaum, and Ernest Drucker, we decided to explore the more neighborhood and personal experiences with guns in New York City.

Specifically, I was interested in three things:

  1. Differences in how genders perceive and experience guns and gun violence.
  2. Difference in the experience of gun violence among age groups in New York City.
  3. Neighborhood level experiences with guns.

Using their data and the free data visualization tool, Tableu Public, I created my own graphics to supplement the findings presented by the Neighborhood Crime and Drug Project.  

Please note: These findings are based on a limited survey conducted throughout NYC neighborhoods, so it is not comprehensive.

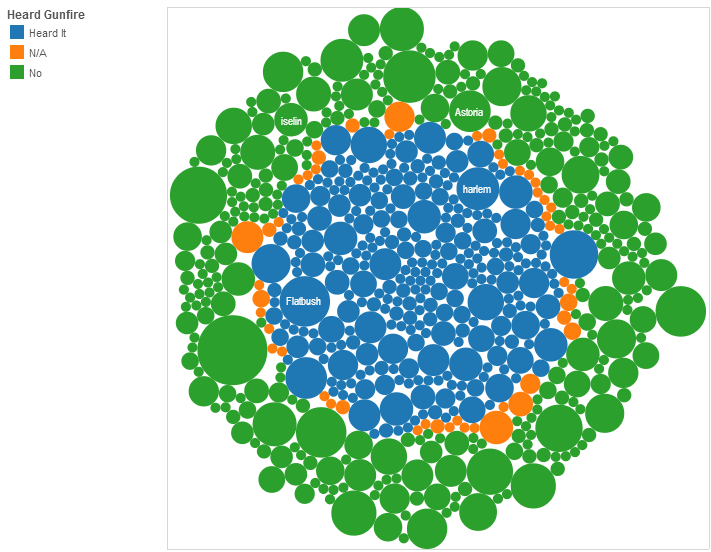
  1. Residents in neighborhoods in South Bronx and Central Brooklyn report having heard the most gun fire.

This interactive bubble chart which you can access here, breaks down reports of hearing gun fire by NYC neighborhood.  The blue bubbles in the center represent those neighborhoods that report hearing gun fire.  Then the size of the bubble represents the numbers of reports for that given neighborhood.  I used a bubble chart in this instance because it can quickly display hundreds of individual values at once.

gun by neighborhood
Credit: JustPublics@365

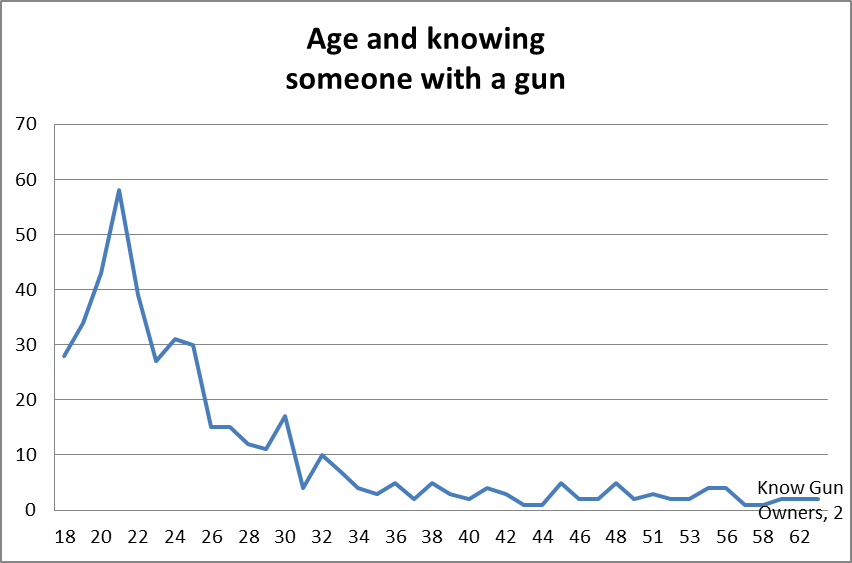
2. The age group most likely to know someone with a gun is 18-29.  It peaks at age 21 and then drops accordingly by age. 

The second age group most likely to know someone with a gun is 30-44.  The age group less likely to know someone with a gun is over 60.  This hints at a possible social dimension to gun use and violence among NYC youth.

Below are two simple charts which illustrate this.  As you can see in the second chart below, the instances of knowing someone with a gun peaks at 21 and then drops the older you get.

18-29 year olds have the highest instances of knowing someone with a gun. 
gunbyage group
Credit: JustPublics@365
 21 year olds in New York City are the most likely to know someone with a gun.  age and knowingCredit: Neighborhood Crime and Drug Project at John Jay University

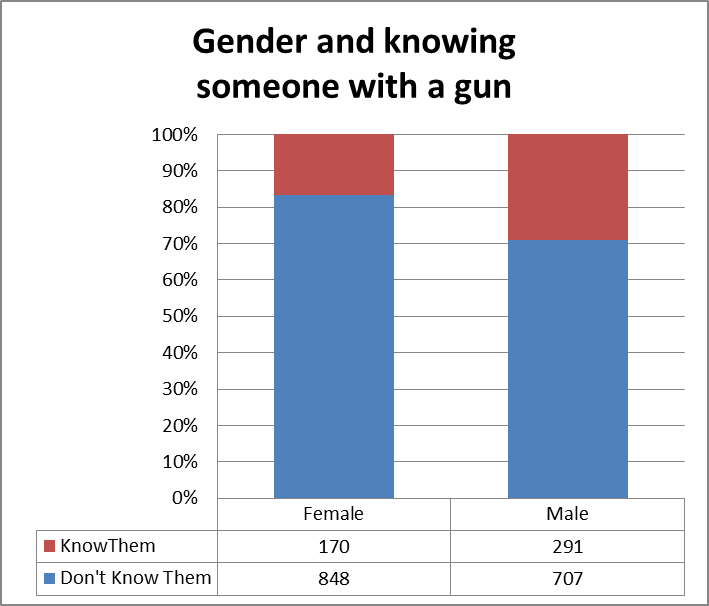
3. Men in NYC are more likely to know someone with a gun, but women in NYC are more likely to have heard a gun shot.

This chart highlights how experiences of gun violence can differ by gender in New York City; as men are more likely to report that they know someone with a gun.

gender and gun
Credit: Neighborhood Crime and Drug Project at John Jay University
scatterplot
Credit: JustPublics@365
gundont know themCredit: JustPublics@365

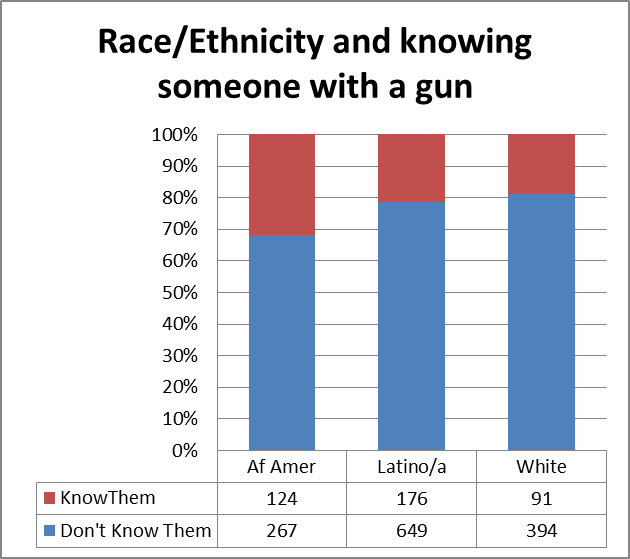
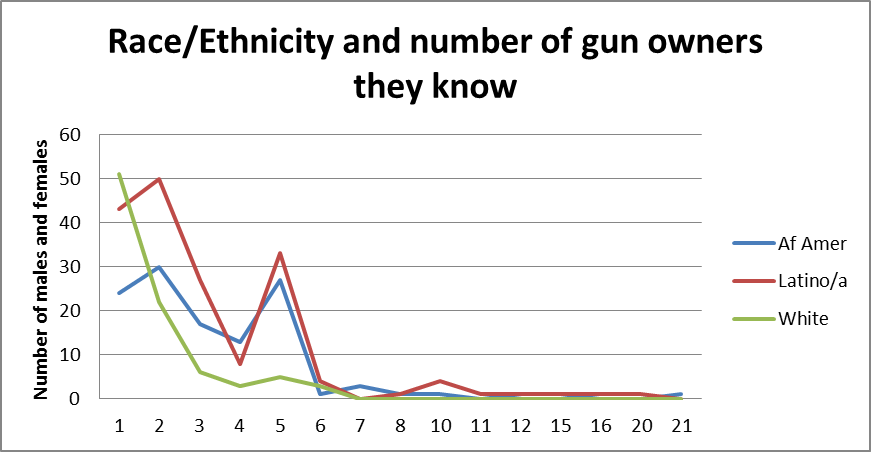
4. African Americans are more likely to know someone with a gun.  However, Latino/as on average tend to know more gun owners.    

race and gun
Credit: Neighborhood Crime and Drug Project at John Jay University

race and number of gun owners 

Credit: Neighborhood Crime and Drug Project at John Jay University

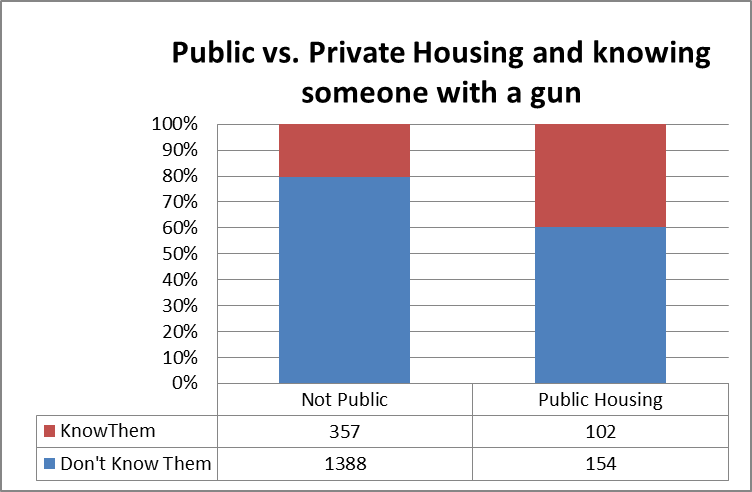
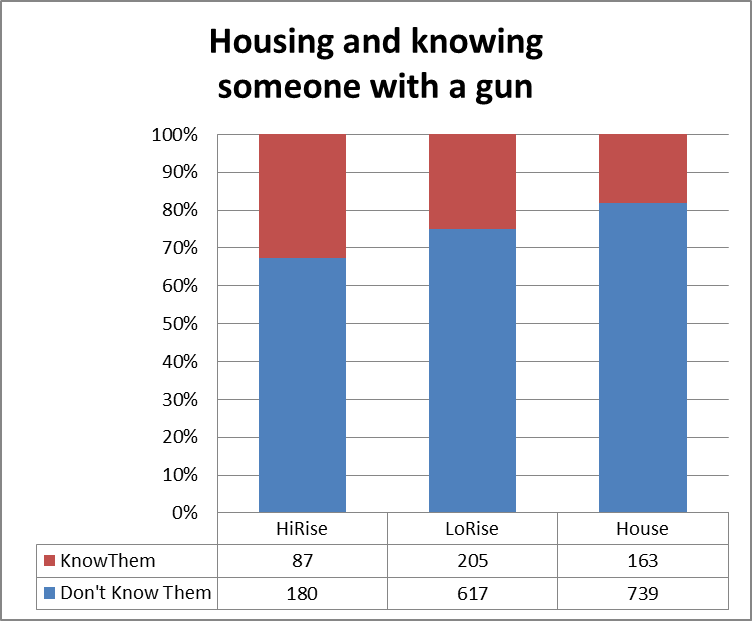
5. Residents in Public Housing and High-Rises Are More Likely To Know Someone with a Gun 

public housing and gun
Credit: Neighborhood Crime and Drug Project at John Jay University


high rise and guns
Credit: Neighborhood Crime and Drug Project at John Jay University


Data on Gun Ownership: Hard to Find

Good data on gun ownership is hard to come by.

Anytime you hear claims about the prevalence of firearms from advocates on either side of the gun regulation debates, you should be skeptical of those statistical claims.

The fact is, there is no national registry of gun ownership.  A few states, such as California, do have registries. The lack of any national gun registry or any system for reporting when guns change ownership means that we can only estimate numbers of firearms owned and distributed.  Each firearm generates a paper trail which, theoretically, could be connected  to its date of manufacture or importation.  While recording manufacture or importation of a gun is required at the federal level, there is no central database of these reports, nor are they widely available so that they could be collected into a database.

Federal Firearms License(Federal Firearms License)

There are lots of problems with the gun-paper-trail.  The law does not require people to keep documentation of private sales (with some variation by state) and as a result the paper trail linking every firearm from manufacturer or importer to current holder can be broken.  Because every firearm can later be sold or gifted, statistics would have to track the chain of transfers from Federal Firearms Licensees (FFLs) to assure that the same gun is not counted multiple times as a “new” sale, or significant overcounts of the prevalence of firearms would result.

However, even if there are multiple undocumented private transfers, the Bureau of Alcohol, Tobacco, Firearms and  Explosives – known as the ATF – can usually trace a gun to its last transfer from an FFL. This is widely referred to as trace data.
There is much misunderstanding about what’s legal in terms of gun sales and transfers. Here are two key facts:

  • it is illegal to sell guns across state lines.
  • it is illegal to sell a gun to anyone who is prohibited by law from owning a firearm.

There are obvious weaknesses in enforcing these prohibitions.  As just one example, many of these peer-to-peer transfers involve relatives and close friends. Even if a means of checking backgrounds existed, the information would probably be ignored. These difficulties in tracking gun transfers also highlight some of the problems with collecting and maintaining reliable data on gun ownership.

Gun Show guns(Image from PBS Newshour:
Is Gun Violence a Matter of Public Health?)

In short, knowing how many guns are available in the USA today, where they are located, and who own them is practically impossible under current law.  The best we can do in estimating data on gun ownership is to take data from individual states and cities that require every sale or gift of a gun to be recorded, and aggregate these datasets.  At best, these describe local conditions only, not national patterns.

However, statistics about the origin of each firearm before it is distributed are robust.  The ATF trace data can usually trace a gun to the last FFL that sold that particular gun. So researchers can look at the ATF data to get a rough idea of where the guns recovered by police (after use in crime) originated.  But the question of source, rather than subsequent ownership or illegal importation numbers or use of various firearms, is the only issue that can be addressed accurately with these data.

Nevertheless, ATF trace data can be analyzed to produce subsets of particular types of gun usage.  ATF trace data is primarily a collection, almost exclusively, of guns recovered from crimes. So the population is “crime guns” which is a distinct subset (rather than a simple sample) of the total number of firearms in the US.

The simplest example is: most guns owned in the USA are long guns (shotguns and rifles,) but most crime guns are handguns.  Using ATF trace data and narrowing the subset even further, only guns that have been actually physically recovered can be traced, so the statistical population becomes:  “Guns Used in Crime which Have Been Recovered by Law Enforcement.” However, even these are undercounted because each law enforcement agency has its own rules about when to request a trace from the ATF. Some agencies have a policy of ‘always request a trace,’ but it is doubtful that all crime guns are actually traced, even from these agencies. Others request a trace only if the firearm looks new, where the trace would help the investigation. If the weapon is a handgun from the 1960s, for example, tracing it to the last FFL transfer will probably be unhelpful for linking the gun to potential criminal suspects, because the gun has likely had multiple private owners over the years. Additionally, many crime guns are stolen from legal owners and transferred among prohibited owners, making traces even less likely to be helpful from a law enforcement perspective. So, in practice, ATF trace data can accurately depict only a subset of gun prevalence, which can be described as:  “the population of guns recovered in crimes for which a particular law enforcement agency requested a trace from the ATF.”  This limited subset of cases is not very helpful for estimating prevalence, distribution, or use of firearms in the USA.

Considering how limited the official reporting of guns sold and licensed in the USA can be, researchers must look to other sources of data about gun ownership and usage.  Statistics from public health sources can help.  Mortality data from the Centers for Disease Control (CDC) is very useful because it includes almost all fatalities involving firearms, both suicides and homicides. However, it does not count gunshots in which wounds resulted, nor shots in which nobody is hit even if the gun is discharged. A large amount of data about misuse of firearms is therefore missing. CDC mortality data does not record any specifics about the type of firearm used, either.  In some cases, local medical examiners record detailed information about shootings (including approximate range of the gun to the decedent, type of gun, caliber,) but this data is not centralized or easily accessible. CDC data entails significant restrictions due to privacy concerns, but does often include a description of where the body the decedent was shot.

State and local police report data can also provide data. Any time the police respond to a firearm crime, someone will file a report. An incident may initially be filed by the police as a homicide but later determined by the medical examiner to be a suicide, or vice versa. Therefore we have to expect some differences in mortality data and police data. Additionally, there most people involved in altercations with firearms give conflicting accounts of what happened. Consequently, witness statements and officer determinations are more questionable in these cases than they are in others, to say nothing of the incidents in which witnesses refuse even to speak to the police, or conversely in which a gun discharge is reported but no corroborating evidence found.

Another police-related source of data is analysis of the firearms a given law enforcement agency actually confiscates.  But law enforcement agencies’ policies can differ. Policies for confiscations, policies for storage of the confiscated firearms, policies about granting researchers access, policies regarding recording and releasing statistics from these confiscations – all are idiosyncratic to the particular law enforcement agency. There is not a centralized data source covering firearms confiscated by police.  And, citing my own personal example in which I sought information about what kinds of guns and how many guns (as opposed to all weapons) have been confiscated in New York under that city’s aggressive stop-and-frisk policy, such information is not made available to the public.

When statistics describing particular phenomena are not widely available or are likely to be inaccurate, researchers often fall back on surveys in which people are asked how often they engage in particular behaviors (such as owning a firearm, or using it, and for what.)  The General Social Survey (GSS) is the most frequently used data sources to study firearms because it is one of the few nationally representative samples in which subjects are asked about firearm ownership. Of course, bias is possible here, too. Some have made convincing arguments that the GSS undercounts firearm ownership because many gun owners are suspicious of authorities asking about their guns, and that there are gendered and regional differences in likelihood of being willing to report a firearm in the house.  Still, it remains valuable resource for collecting gun ownership data.

gun culture(Image source)

Survey and interview data in general about firearms must be treated with care. Firearms are powerful symbols with multiple – and conflicting – meanings. As a result, survey answers about firearms are likely to be less than accurate.

Phillip Cook has produced a formula for estimation, using CDC and police data about homicide and suicide, to estimate use of guns. For now, Cook’s Index is the closest thing scholars studying firearms have agreed is the best measure – though scarcely a perfect one — for estimating firearm use in causing human deaths, though not the prevalence of gun ownership or usage generally.   His formula utilizes the overall numbers of homicide and suicides and determines the percentage of each committed with a firearm.  Local telephone surveys asking people about firearm ownership confirm that Cook’s Index correlates closely with firearm availability. It is expected that there are variations cross-nationally with this estimate, and over time.

Right now, the it is impossible to say with any precision how many guns are currently in use of guns in the US.  By piecing together data from a variety of law enforcement, federal statistics about gun origins, and public health sources, a rough picture can emerge.  Improving these databases is the next goal for researchers.

~ This guest blog was written by Candace McCoy Professor, John Jay College and The Graduate Center, CUNY.


Reframing Gun Violence as a Public Health Issue

Our series on “Punishment to Public Health” continues. This week, we turn our attention to gun violence as a public health issue.  In many ways, this is a key example of the way that our usual policies of criminalization around guns have failed us as a society.

No Gun Sign - Mall of America(Image source)

The harm from guns to peoples’ health is hard to deny.  The U.S. leads the world in gun deaths, according to a World Health Organization (WHO) study. Guns claim more than 30,000 lives each year in the U.S., more than five times the number of deaths from illegal drugs each year. While a great deal of media attention focused on the tragic shooting of elementary school children at Newtown, CT.,  the Children’s Defense Fund estimates that 2,391 children have been shot by guns since the beginning of 2013 alone.

Currently, our response to guns and gun policy is one that oscillates between a punitive criminalization of some gun owners and a staunch, Second Amendment defense of other gun owners.  How might society be changed if our approach to guns and gun violence were reframed as a public health issue, like seat belts or smoking?

no smoking sign(Image source)

We’ll explore some of the research on guns and look at some of the ways that activists and documentary filmmakers are contributing to a resistive reframing of gun violence as a public health issue.

Mapping Social Inequities: Using Evernote for Evidence-Gathering

 Mapping Social Inequities

Although my post last week discussed how data visualizations such as maps could be used to promote social change, often overlooked are discussions regarding tips and tools for gathering evidence which can be used for mapping social inequities.  Therefore, this post explores how Evernote 5 can be used as a free and powerful evidence-gathering digital tool for highlighting social inequities. Evernote 5 is available for free for both Mac and recently released for Windows.

In an interview with Eric Cadora from The Justice Mapping Center, for our From Punishment To Public Health (P2PH) Social Justice Topic Series, he showcases how maps can expose the cross-sections between public health and public safety in vulnerable communities.  Specifically, Cadora finds that populations which often experience chronic ill-health are often also the same populations which are in and out of prison and jail.  Other studies have found a correlation between crime and chronic disease, which are often reinforced by high levels of health illiteracy and disparity (The Poverty Clinic, Paul Tough).

As the worlds of public health and public safety continue to merge, this presents valuable opportunities for academics and social justice advocates to document and gather evidence of how these dynamics play out within their communities.

I decided to begin my own evidence-gathering efforts as I went about my travels throughout New York City.  For my exercise, I was interested in gathering evidence on the types and number of community health clinics that existed in high crime NYC neighborhoods.

In order to do this, I downloaded both the App and web version of Evernote 5 (App versions are available for Iphones and Android).

For those not familiar, Evernote is a note-taking and clipping application that lets you save all kinds of bits of information into various project-oriented “notebooks.” Academics have been using Evernote to write dissertations or articles, conduct classes and research, etc.  However, less is known about how it can be used for evidence and information-gathering.

FOR STARTERS – Aspects of Evernote that make it an especially useful tool for evidence-gathering are:

  • Ability to go almost completely paperless! Digitize your physical notes and back them up in the cloud. This can come especially handy when ensuring the protection of sensitive documents and information.
  • Allows you to collect an array of multi-media and documents and keep it neatly organized and searchable: You can further use Evernote’s tagging feature and then take advantage of their amazing search and filtering capabilities. In Evernote, you can search by: keywords, tags, dates, or note types (such as images, audio, PDF, etc.). Evernote’s optical character recognition capability (OCR) also converts images of letters/numbers into searchable text (for example as in words from a photo, scanned document, or PDF).
  • Use your personal Evernote email address @m.evernote.com: This allows you to email notes to specific project notebooks and keep your evidence well-organized.
  • Collaborate and share your work with others: Create a link to a private shared workspace and send it to everyone involved. At the same time, you can make any of your notebooks publics which can then be posted on a webpage or included in an email.
  • Dictate your thoughts, ideas or conversations if you have a smart mobile device. You can then use Voice2Note to then convert audio notes into text to make them easily searchable. Simply connect your Evernote account and the first 30 seconds of your notes will be transcribed.
  • Use the Atlas feature to capture GPS information along with the notes you take (now available in Evernote 5): For example, you can use this if you want to capture the specific location of an event, where evidence was found or collected, image taken, etc.
  • This in return allows you to start visualizing geo-specific trends that may either highlight gaps in your evidence-gathering or important issues and patterns that warrant further exploration.  Most importantly, it allows you to start outlining the key trends for your mapping visualization.
  • The Evernote app allows you to effortlessly capture evidence during your day-to-day activities: This means that you will always be prepared to quickly capture, geo-code, and catalog a valuable piece of information for future reference.

Setting Up Your Evernote Evidence-Gathering Notebook

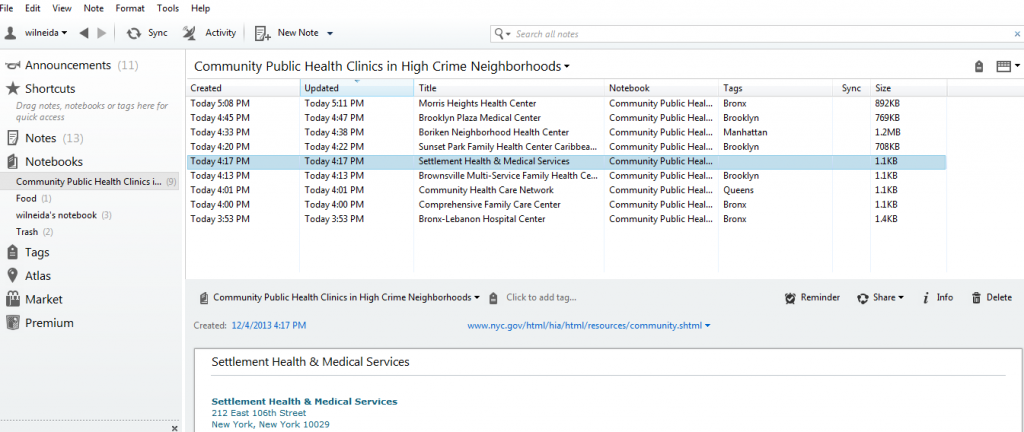
Using the web version of Evernote 5, I create a notebook called, Community Public Health Clinics in High Crime Neighborhoods.  Once I created this notebook, I was then able to upload evidence of community public health clinics in several forms, notes, images, audio, or video.

evernote 5

My evidence-gathering notebook where I can upload notes, images, audio, or video and geo-code them.

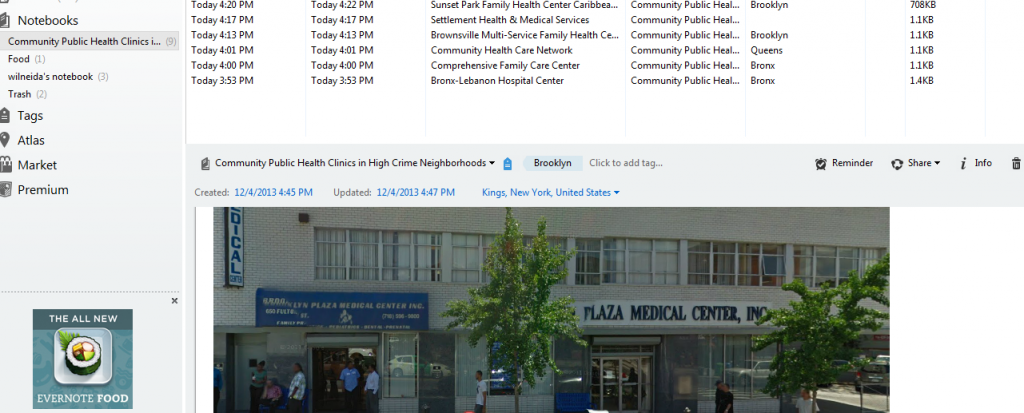
evernote evidence gathering                    Here you can see images of the clinics I have uploaded for future reference. 


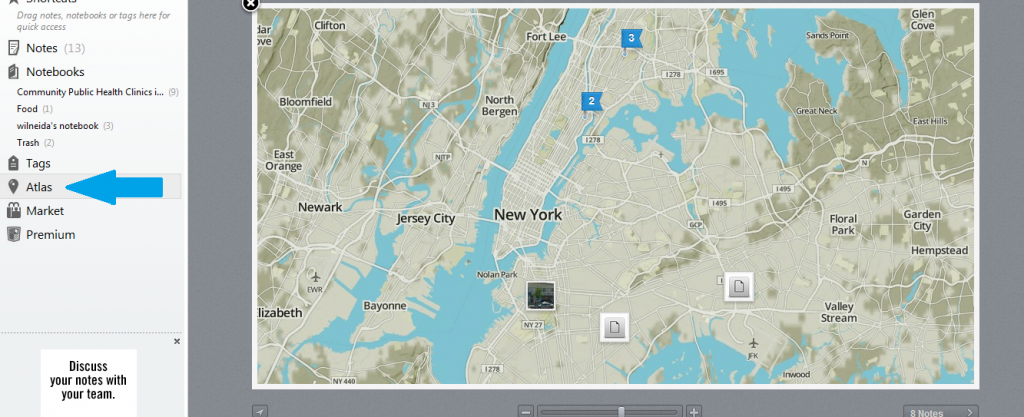
Finally, Evernote 5’s Atlas feature allows me to see my notes, images, and pictures in map view.  This map views helps (a) to ensure that you are covering all the locations/areas that you want to focus on and (b) helps ensure the accuracy of the location for each piece of evidence collected.  

evernote 3Here you can see images and notes regarding community health clinics which I have uploaded for future reference.

Final Thoughts

Moving beyond map visualizations, there are many contexts and ways to use evidence for promoting social justice.  Consider, these real-life examples from the New Tactics in Human Rights website of the types of social justice contexts which Evernote’s features could be most useful for:

Documenting cases of injustices that can be used as legal documentation in courts: See example of collaboration between a human rights group and local monitoring teams in Yemen.

For coordinating and gathering info during participatory research: Read about how groups and individuals in Mozambique launched a collaborative effort to train locals on data gathering which also gave local NGOs a concrete research instrument they could use for future endeavors.
Using technology to share and gather information on environmental hazards: This is where Evernote’s mapping/Atlas feature can really come in! Read about how Environmental Defense used technology to categorize information about harmful environmental hazards such as air pollutants, toxic chemicals, etc.
Collect and preserve community stories and testimonies: Read about how scholars trained in reading and interpreting the texts worked with locals in Tibet to enter ancient text into an electronic database.

***

This post is part of the Monthly Social Justice Topic Series on From Punishment To Public Health (P2PH). If you have any questions, research that you would like to share related to P2PH or are interested in being interviewed for the series, please contact Morgane Richardson at justpublics365@gmail.com with the subject line, “P2PH Series.”

Special Interview with Eric Cadora on Mapping, Criminalization, and Public Health

eric-cadora

I had the opportunity to interview Eric Cadora, the founder of the Justice Mapping Center. In this interview, we talk about Mapping, Criminalization and Public Health.


Can you share a little bit about how your writing or your data visualizations speak to issues of criminalization and public health?

First and foremost, I think, what we were trying to do through using maps and geography to talk about criminal justice was we’ve been trying to reframe the conversation about crime and public safety onto communities rather than on crime, and one of the things that occurred to me when we first started doing this was that if you shift the focus from crime events to where people live who are going in and out of prison and you map that, you’re going to have a very different story than if you’re looking at crime maps, which were much more popular. By shifting it to show the disproportionate concentration of criminal justice in particular neighborhoods, you can start to talk about places rather than get pigeon holed in that getting tough, being soft polemic that everyone got stuck on. It was a story that I didn’t think had really been told empirically, so we started collecting data from places about where people lived who were going in and out of prison and jail, and that helped us paint a geographic picture and, of course, maps are a much more compelling way to portray the issue because everyone gets it, whether you’re a researcher or a legislator, and everybody sees immediately what’s going on, which turns out to be really this mass migration, population displacement and resettlement project, even if unintentional, so that when you map where people are going in and out of prison from and returning to, you see this almost pattern of mass migration.

Then we thought, “Let’s try to dramatize the trade offs in the underwriting of this whole cycling process. Because we had collected data on where everyone lived who was going in and out of prison, where they went to and for how long, and you know how much it cost per day, we were able to translate the data into dollar estimates of block by block, how much is New York State paying to remove and return people from each of these blocks? When we first looked at Brooklyn, we found 35 of what we then coined as “Million-dollar blocks,” single city blocks for which the State was paying more than a million dollars a year to remove and return people to and from prison on average for about three-and-a-half years or so. Of course, none of that money was going into those places. It was renting prison cells, and so, by doing the million-dollar blocks graphics and geographics, we were able to shift the conversation and suggest that there’s a trade off there, and that those dollars are really there for the benefit of the well being of those places.

Then you ask the imaginary question. If you had the million dollars a year, that block and those guys, what would you do? Would you spend it all on sending them away for two or three years and then having them come back with no changes to the neighborhood, or would you try to reinvest them in some other conditions that are prevalent in the neighborhood itself?

Ultimately, what we’ve done is tried to show that these places are inundated with criminal justice and that no more criminal justice is going to make any difference, and that, in fact, when we look at the other kinds of data about those neighborhoods, like living environments, housing costs, income, poverty levels, health, etc., we start to find that there are many weak civil institutions, and in some ways, the criminal justice system is responding to that poverty and ill health with more criminal justice, as if that could sort of balance it out for the weakness of those other institutions, and of course, it doesn’t.

Portraying all this vis a vis maps of neighborhoods has been a way of showing where the rubber really hits the road because even though we know about about a lot of the statistics about mass incarceration and disproportionality, those disproportionalities are mild compared to the ones between one neighborhood and another in any particular major city. That’s where the real differences are, and you really start to see where the system takes effect.

As time has gone on, though, we’ve been looking more at these neighborhoods, and what becomes evident and what linked up in our mind with public health and the inevitability of really thinking more about this in terms of public health and public safety is that these neighborhoods are increasingly characterized by emergency response systems, urgent care response systems, so not just the prison or the jail but also the emergency room. The homeless shelter, foster care, etc. Last resort options. Last resort techniques, but mainly into populations that suffer from chronic issues. Increasingly, once we start to add these up, we see incredible amounts of money being spent for emergency response systems for people who need chronic neighborhood network care, not emergency response care, and that’s where we’ve been increasingly focusing our vision on how do you dramatize that issue and start to suggest ways in which you can pull out of those emergency response approaches and start to develop the more useful neighborhood chronic care networks and outreach systems.


What are your thoughts on policy approaches that draw from public health rather than criminal justice? Do you think that these are better or just reproduce the same systems of inequality?

That’s an awfully good question. There is an increasing realization in public health about the need for harm reduction approaches rather than emergency, and I think there’s also an increasing realization that these emergency response systems are simply making up for weak civil chronic care systems. Increasingly, I think there is attention to, “Why are we treating asthma, why are we treating outcomes of obesity, why are we treating drug addiction in emergency rooms at incredible costs and very little effect when these are issues that are more chronic and require prevention, education, and on-the-ground kinds of services that are a little more sophisticated than the big institution?”

Instead of plopping a big hospital or a big community center or a big … All these kinds of things are suggesting increasingly that integrating networks of public health and public safety into the networks that are already active in those neighborhoods. People are already grappling with health issues, are already grappling with problems of unemployment and problems of criminal justice, so what’s a little more difficult but much more effective is this understanding that we should tap into those networks and let’s help mobilize those that are already on the ground. I think public health environments are increasingly realizing that, but I also think that criminal justice solutions can really find a purchase in public health thinking, particularly around harm reduction and chronic care, so that we come up with the kinds of responses to crime and criminal offenses and so on that are not simply harmful and costly with very little productivity and a great deal of cost to the community but in fact, could be integrated into those networks in the community, into developing community service work, into a whole range of options that don’t necessarily require iron bars and concrete walls for punishment, and I think public health, because the public health environment suffers from some of the same over urgent care responses, it also has a lot more tested solutions, I think, to those problems that criminal justice can borrow and take advantage of.

I also think that people just don’t realize how closely the populations are overlapping; that is, populations that are in chronic ill health over time due to relationships with poverty and so on are the same populations that are going in and out or prison and jail, and so understanding those two as a single group in a certain way gives you more opportunity to wed solutions that are greater, where the whole is greater than the individual parts. I think it’s inevitable, in fact, that public health and safety will be increasingly considered a thing, a single unitary way of thinking, rather than this more fractured sense of criminal justice and healthcare.


A major focus of JustPublics@365 is bringing together academics, activists and journalists in ways that promote social justice, civic engagement and greater democracy. What sort of ‘lessons learned’ do you have from your experience with entering a terrain more frequently trod by activists and academics?

Yeah. I’ll admit, that’s kind of what one of the sort of planks of our approach has been to say, “Look. Most stories are about crime in the criminal justice journalist’s word, and those that aren’t are about reentry or prisons and tend to be anecdotal or, if they’re statistics, they tend to be very far reaching, but I think journalists can find better purchase in stories that focus on specific neighborhoods and understanding the hyper concentration of criminal justice in those places and starting to reveal those or tell those stories in a way that both highlights these new data and this new realization about these highly-concentrated, incarceration hotspots, you might say, and the collective impact on those neighborhoods of such a large proportion of mainly parenting-aged and working-aged men recycling through the prison system back into the community en masse, in a way that makes the whole community downwardly mobile and instead of being a solution to what’s been going on to crime and so on, the cure itself has become a measure of disadvantage in those neighborhoods so that when you look at a place and you say, “Well, it’s high poverty, low income, high incarceration itself is now one of those disadvantages because of the terrible impact it has on future life chances, whether it’s employment or health or education or even staying out of jail.

I think increasingly journalists an turn to these new sources of data, and this stuff has, I’d say, emerged over the last decade where the focus of the crime conversation is no longer simply crime prevention techniques but rather, a better understanding of what hyper criminal justice activity, what kind of damage that is causing, and the pretty obvious and straight forward, available solutions there are to remedy that.

***

This post is part of the Monthly Social Justice Topic Series on From Punishment To Public Health (P2PH). If you have any questions, research that you would like to share related to P2PH or are interested in being interviewed for the series, please contact Morgane Richardson at justpublics365@gmail.com with the subject line, “P2PH Series.”

Criminalization, Unemployment and Health: Kai Wright, William Gallo and Glenn E. Martin in Conversation

In a recent piece,  “Boxed In: How a Criminal Record Keeps you Unemployed for Life,”  Kai Wright, editorial director at Colorlines and a contributor to The Nation, takes an in-depth look at the impact of a criminal record on future employment.  In our ongoing effort to curate conversations between journalists, academics and activists around social justice issues for broad audiences, we partnered with TechChange and invited Kai Wright, Professor William Gallo and Glenn E. Martin to have a conversation about the connections between criminalization, unemployment and health, moderated by JustPublics@365 Digital Fellow Heidi Knoblauch.
http://www.youtube.com/watch?v=AsQe6RBKHww&feature=share

In this extended discussion (1:55), our panel of experts Kai Wright (@Kai_Wright),  William (Bill) Gallo, Professor of Public Health at The Graduate Center, CUNY and Hunter College, and an expert in the health consequences of unemployment, and Glenn E. Martin (@glennEmartin), is vice president of development and public affairs of Fortune Society, a New York-based prisoner re-entry advocacy group, each discuss how journalists, academics and activists approach the same issue from different vantage points but with a shared goal of creating a more just society.

Women in Prison: Twice as Likely to Have History of Abuse

The rate of women who are incarcerated, whether in prison or jail, is increasing. According to the ACLU, more than 200,000 women are currently in jail or prison, and another 1 million are under the control of the probation and parole system.

women in prison(Image source)

While many of the demographics for women in prison parallel those of men – that is, they are disproportionately black and poor – a closer look reveals another story.  Women bring a gendered life experience with them to incarceration.  And, being gendered ‘woman’ in this society often means a series of difficult life circumstances and hardships, like physical or sexual abuse in childhood or as an adult.  Incarceration places the additional burdens of isolation, humiliation, and systemic marginalization to these gendered life experiences.

It is precisely because of their gendered life experiences prior to incarceration that women need gender-based interventions in order to re-enter their communities and rejoin their families.

National Profile of Women Offenders
A profile based on national data (NICIC.gov: “Gender-Responsive Strategies”) for women offenders reveals the following characteristics:

  • Disproportionately women of color.
  • In their early to mid-30s.
  • Most likely to have been convicted of a drug-related offense.
  • From fragmented families that include other family members who also have been involved with the criminal justice system.
  • Survivors of physical and/or sexual abuse as children and adults.
  • Individuals with significant substance abuse problems.
  • Individuals with multiple physical and mental health problems.
  • Unmarried mothers of minor children.
  • Individuals with a high school or general equivalency diploma (GED) but limited vocational training and sporadic work histories.

One in three
One can hardly talk (intelligently) about women in prison without talking about childhood trauma and physical and sexual abuse.

Earlier this year, the Correctional Association of New York – a 170-year-old advocacy organization that leads efforts to protect and advance the rights of incarcerated women and their families – published the following facts about women and the criminal justice system:

  • At least one in three girls in the United States is sexually abused by the time they reach the age of 18.
  • Women in prison are twice as likely as women in the general public to report childhood histories of physical or sexual abuse.
  • Nationally, more than 37% of women in state prisons have been raped before incarceration.
  • 90% of women incarcerated at Bedford Hills reported suffering physical or sexual violence in their lifetimes.
  • 82% of women at Bedford Hills reported having a childhood history of severe physical and/or sexual abuse.

Yet another casualty of the war on drugs, most women are behind bars because of non-violent drug-related offenses. Much of their substance abuse is generally understood as “self-medication”, a device to help them cope with the aftershocks of traumatic childhood experiences – such as, in many cases, parental incarceration. In addition, the flood of crack cocaine that hit urban areas in the 1980s increased women’s experience of another kind of sexual trauma, street-level prostitution – a mainstay survival strategy for women addicts along with low-level drug dealing and petty property crimes.

free marissa signs(Image source)

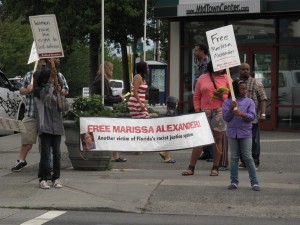
The recent case of Marissa Alexander, sentenced to 20 years in a Florida prison for firing warning shots into the ceiling in an attempt to fend off her abusive husband, brought the national spotlight to the fate of many women who dare defend themselves and their children from their abusers.  Marissa’s appeal was successful and she has been granted a new trial – although she has been incarcerated since 2010. The Correctional Association has been spearheading the campaign to pass the Domestic Violence Survivors Justice Act, which would change New York State laws that require long, harsh sentences for survivors who protect themselves from an abuser’s violence.

Impact of Incarceration on Children, Families
Attorney General Eric Holder’s recent declaration that “too many Americans go to too many prisons for far too long, and for no truly good law enforcement reason” has drawn public attention to the issue of mass incarceration.  One area that still needs even greater attention is the impact that incarceration has on children and families.

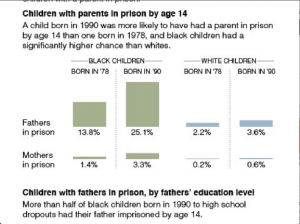
Screen Shot 2013-12-03 at 1.14.53 PMClick image to enlarge.

(Sources: Christopher Wildeman, “Parental Imprisonment, the Prison Boom, and the Concentration of Childhood Disadvantage,” Demography, May, 2009;  and The New York Times, July 4, 2009)

Over 2.3 million children in the United States currently have a parent who is incarcerated in the jail or prison system and over 10 million children have experienced parental incarceration in their lifetime.  The social and health risks and outcomes that parental incarceration has on children include increased stress, family disruption, feelings of abandonment, traumatic separation, loneliness, stigma, unstable childcare arrangements, strained parenting, reduced care giving abilities upon reunification, and home, school, and neighborhood moves.

Visitation with children in prison is not an option for most mothers in prison for the duration of their time behind bars and, on average, the children of incarcerated mothers will live with at least two different caregivers during the period of their incarceration.  More than half will experience separation from their siblings.

Upon release from incarceration, reuniting with the incarcerated parent with his or her children is often desirable; however, the actual impact of the reunification process on children and families merits further investigation.  Reunions often causes stress to both parent and children because for better or for worse it constitutes a disruption of the status quo, and as such demands that both adults and children adapt to new household dynamics, especially if children had previously been placed in foster care. Bonds broken by incarceration are not easily mended, and children may experience difficulty in forming meaningful attachments for the rest of their lives.

Generally lacking adequate job skills, most women have trouble supporting a family upon their release from prison, and the communities to which they return are unprepared to receive them. And after serving their time, a woman’s criminal record may bar them, through law or practice, from accessing vital resources, such as employment; public housing; welfare benefits; food stamps; financial assistance for education. These post-conviction penalties constitute an ongoing and self-perpetuating additional layer of punishment that endures far beyond their prison sentence.

Designing programs for impact
According to the Women’s Prison Association, programs aimed at supporting women returning from prison must take account of the family responsibilities women bear.  Programs should be designed with the understanding that women and their families are often burdened with conflicting and inflexible requirements of multiple agencies.  Criminal justice, welfare and child welfare agencies may set competing or conflicting goals and conditions for women, while limiting or denying access to essential services needed to stabilize and maintain the family unit.

Family reunion(Image credit: Michael Kirby for The New York Times)

Family-focused Alternative to Incarceration (ATI) programs such as Drew House in Brooklyn, NY, have been successful at providing selected women charged with felonies and their children with the tools and the chance to strengthen these families without compromising public safety. However, the need to collect and coherently use women-centered data when addressing incarcerated women remains crucial for the relevance and success of any intervention.

~This post was co-authored by Alice Cini and Stephanie Hubbard.  Alice Cini is a social justice advocate and Social Work Fellow at the John Jay College of Criminal Justice’s From Punishment to Public Health Initiative. You can follow her on Twitter @CinikAl. Stephanie Hubbard is a public health professional and advocate for youth and humans rights at Columbia University’s Mailman School of Public Health.

***

This post is part of the Monthly Social Justice Topic Series on From Punishment To Public Health (P2PH). If you have any questions, research that you would like to share related to P2PH or are interested in being interviewed for the series, please contact Morgane Richardson at justpublics365@gmail.com with the subject line, “P2PH Series.”

Special Interview with gabriel sayegh on Municipal Drug Strategies

gabriel sayeghThis week I interviewed gabriel sayegh, the director of the Drug Policy Alliance’s New York policy office. In this interview, we talk about municipal drug strategies in Canada and Europe and explore opportunities for New York to implement these types of municipal-drug strategies.


What are municipal drug strategies?

Municipal drug strategy is simply a city-based strategy for approaching the problems of drugs and that when you have a situation of opening our drug market as an example or drug-related disorder, cities are often the first jurisdictions that have to address and deal with those problems. Of course, not every element of drug use is a problem. That’s not the case at all but there are instances particularly in cities when drug use can become deeply problematic, either because of overdose fatalities or the transmission of HIV and AIDS or drug related crime or disorder related to open drug markets or public drug consumption. Continue reading

Data Advocacy: Visualizations for Promoting Change

The report, Blueprint for a Public Health and Safety Approach to Drug Policy, by the Drug Policy Alliance and The New York Academy of Medicine provides a comprehensive set of recommendations for fixing a broken drug policy that is a “bifurcation between two different and often contradictory approaches – one which treats drug use as a crime and the other view, as a chronic relapsing health or behavioral condition.”

Anyone who has spent time working in human services knows that multiple programs (whether offered through community groups, nonprofits, churches, or government agencies at the local, state, and federal level), own a piece of the puzzle when it comes to helping and healing people and families. In the case of substance abuse treatment, there’s a myriad of actors in health/mental health, schools, substance abuse services, law enforcement, corrections, and departments of children and families who all need to be coordinating and working together. However, as the Blueprint highlights, this does not always happen. Rather, “without a united framework and better coordination, these actors and agencies often work at cross-purposes” (Blueprint Report, pg. 4). The themes of coordination, overlapping, and cross-purposes appear throughout the report, and these are what I highlight in the discussion of data visualization here.

Provoking Change: Your Data Can Tell a Story

Data visualizations can tell a clear concise story about why an issue is important and why change is needed. So, they are ideal tools for fostering greater awareness and supporting advocacy efforts.

Data visualizations are often associated with their popular counterparts, information graphics (aka infographics).  Although both allow you to use and transform your data into a compelling presentation or powerful story, there is a key difference between the two. While data visualizations take complex sets of data and display them in a graphical interface, like a chart or map, so users can gain insight into patterns and trends, infographics use data visualizations in concert with text and other tactics to tell a story, make a point or communicate a concept (“Data Visualization and Infographics: Using Data to Tell Your Story”).

Visualizations are especially effective for data advocacy because they:

  • Make your message more compelling: Let’s face it, visualizations are simply much better at stimulating thought and conversation than more traditional textual or numerical data.
  • Allow you to reach a wider and more diverse audience:  The reason for this is that visualizations allow you to convey complex data and abstract information in an easily digestible and shareable formats.
  • Visualize information, systems, networks and flows which can be valuable for highlighting social problems and need for policy changes.
  • Illustrate timelines and relationships that can help readers put the dots together in understanding a problem (“Data Visualization and Infographics: Using Data to Tell Your Story”).

Visualizing New York Drug Policy

This next section outlines step-by-step instructions to create your own data visualization. I searched NYC Open Data and Open Data NY Gov for the best data set that would help me highlight the idea of overlapping human services agencies that work on substance abuse issues in New York State. The best data set I found was one which provided information on Local Mental Health Program in New York State, broken by county and program subcategory.

Because of the geographic nature of this data, I opted to create a heat map.  Because I was also interested seeing the distribution of the types of substance abuse mental health programs in New York according to county, I found a histogram to be useful as well.  I then selected two free and easy-to-use data visualizations tools: Many Eyes and Tableau Public.

This brings me to the first lesson in creating data visualizations:

 (1) Don’t be seduced by the exciting and cool visualization tools: In creating visualizations for advocacy and social change, it’s critical to keep in mind your objective and to avoid visualizations which just offer eye-candy.   You want the reader to be attracted to your message, not your methodology or the cool visual tools you used.  So, ask yourself if you want your data to provide (a) description, (b) exploration, (c) tabulation, or (d) decoration (see Tufte’s “The Visual Display of Quantitative Information.” )   There is a lot you can accomplish visually with basic free tools such as the two that I used.  However, for a full list of all data visualizations tool available visit Bamboo DiRT.

(2) Prep your data: Every great visualization begins with a coherent and well-organized data set.  As a result, it’s important to clean your data and only leave the most essential variables organized in the best possible format to reveal the main relationships that you want to highlight between your variables.

Two free tools which can help you clean and prep  your data for visualization are:

For my data set of Local Mental Health Program in New York State, I filtered the data according to those that provided substance abuse counseling and then I created a frequency distribution with a pivot table.  Pivot tables (also called contingency tables and cross tabulation tables) are a powerful means of data visualization and data summarization.  You can download my pivot table here if you would like to experiment with it.

Mental Health Program Sub-Categories

Assertive Community Treatment Care Coordination
Clinic Treatment Comprehensive Psychiatric
Emergency Continuing Day Treatment
Crisis Day Treatment Education Forensics
General Hospital Psychiatric IP Unit General Support
Intensive Psychiatric Rehabilitation
Partial Hospitalization Personalized Recovery-Oriented Services
Private Psychiatric Hospital Residential Treatment Facility
Self-Help State Psychiatric Hospital
Support Program Treatment Program
Unlicensed Housing Vocational

Many Eyes provides information on how to format your data according to the visualization that you chose.

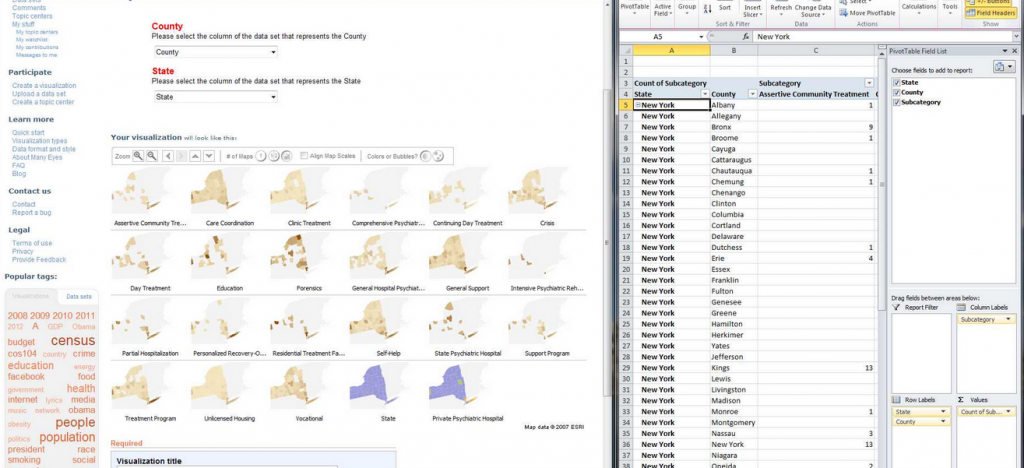
Pivot Table into Many Eyes

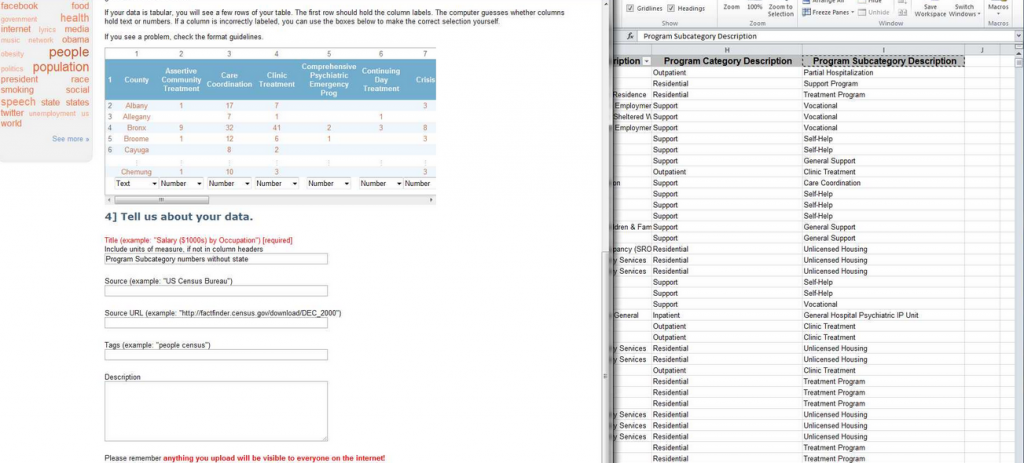
After creating a pivot table of my data which adds up the total number of program subcategories according to county in New York, I am then able to upload the data onto Many Eyes.

 finalizing pivot data

After uploading the data, I compared how the pivot data appears on Many Eyes versus my spreadsheet to ensure data accuracy.

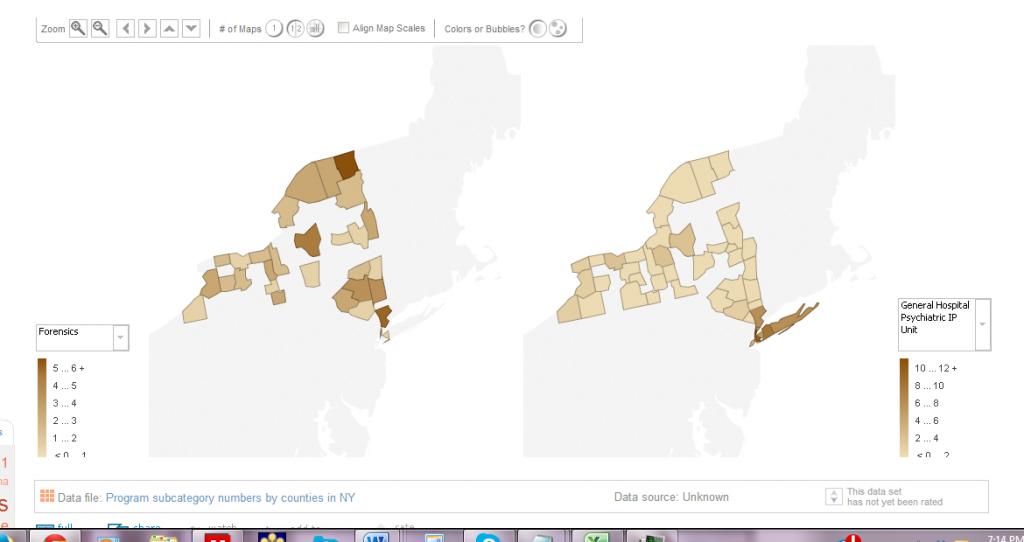
To see the final interactive heat map designed on Many Eyes click on the image below:

 Many Eyes Heat Map

 This heat map showcases the density of mental health programs that deal with substance abuse in New York State.  The heat map is interactive because the key allows you to select different sub-program categories to see which counties have the most programs and which don’t.  

(3) Ensure Content Focus: The best visualizations are transparent about the data used.  As a result, in designing my interactive heat map, I also included drop down menus for people to see what types of substance abuse programs were available in which counties and which were not.  As a result, I wanted to keep the focus on the content of the data and not necessarily on the very cool heat map that I just made!

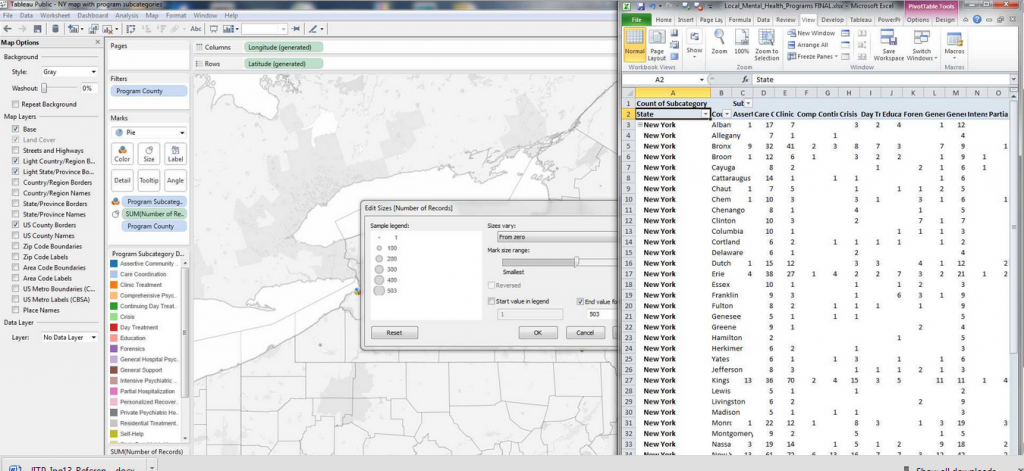
(4) Reveal the data at several levels of detail, from a broad overview to the fine structure:  Tableau Public offers much more customization features which allow you to showcase your data on many different levels.

Tableau dashboard

Tableau dashboard features more options for organizing your data and highlighting specific trends geographically broadly or on a more granular level.  

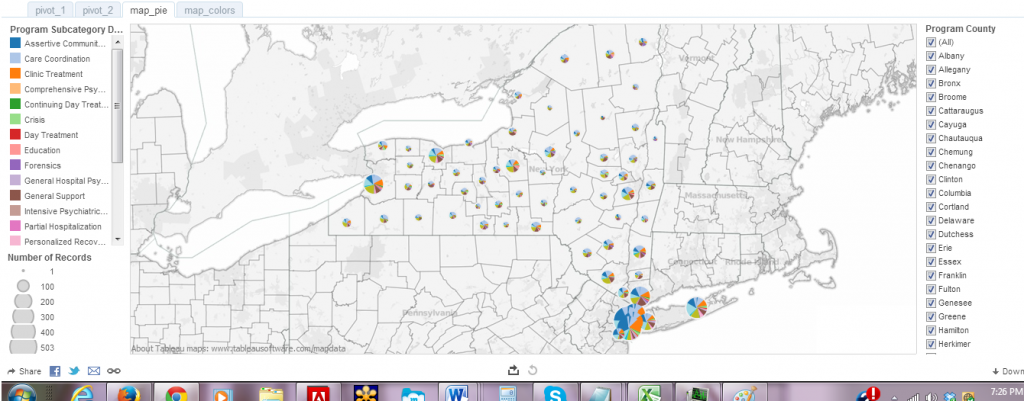
(5) Avoid Distorting the Data: A good visualization should always showcase the data honestly.  As a result, things such as pie graphs and charts are frowned upon because they of their distortion of the data and lack of clarity.  This is what’s often deemed as avoiding “chart junk” (Tufte).

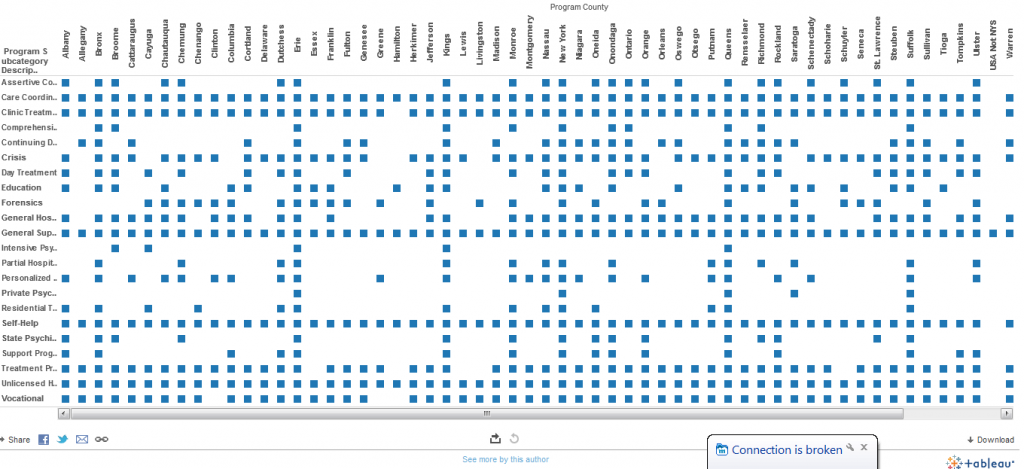
For example, my pivot table histogram below does a better visual picture of highlighting consistencies and gaps in mental health services across program sub-categories and counties than the map using pie charts.  

pivot table chart

Pivot table histogram highlighting the distribution of each mental health program sub category by counties.  As a result, this visual quickly shows you the overlaps as well as gap in services.

Now look at my same pivot table data but this time using pie charts rather than heat map or histogram.  Although, somewhat visually appealing, the pie charts do not shows how the programs each make up a whole, thereby, disguising the potential problems of overlap.

piegraphs

Becoming a Data Visualization Expert: Final Tips and Resources

 (6) Make it memorable:  Studies have found that memorability alone can enhance the effectiveness of visualizations.   A recent study, which is the most comprehensive study of visualizations to date, found that visualizations that were most memorable had:

  • Human recognizable objects”, these were images with photographs, body parts, and icons–things that people regularly encounter in their daily lives.
  • Effective use of color, specifically, visualizations with more than six colors were much more memorable than those with only a few colors or a black-and-white gradient.
  • Visual density, meaning that visuals that had a lot going on were more memorable than minimalist approaches.

For inspiration on data visualizations that promote advocacy and social change visit: